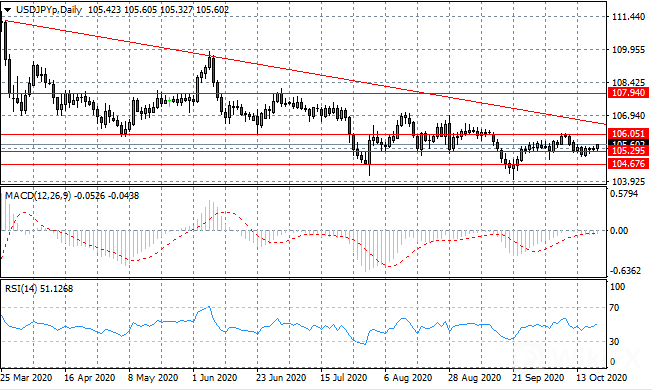
USD/JPY
USD/JPY buyers have returned after stalling at the 105.29 price level. Whether the pair can reach or even test the range ceiling at the 106.05 price level remains to be seen. Buyers conviction will be tested. Momentum indicators have upward trajectories.
USD/JPY买方止步于105.29价格后已经回归。该货币对能否达到甚至测试106.05价格区间上限仍有待观察。买方信心将经受考验。动量指标有向上的轨迹。
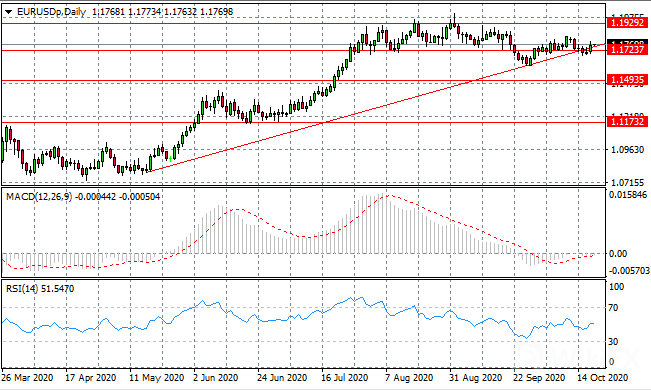
EUR/USD
The Eurodollar has found support at the 1.172 support level and ascending trendline which has represented a strong support area for the pair. The pair is now re-entering into a previous consolidation channel. Momentum indicators have flattened in neutral territory.
Eurodollar在1.172支撑位及上升趋势线找到支撑,代表了该货币对强有力的支撑区。目前该货币对正重新进入此前的盘整位置。动量指标在中立区域趋于平缓。
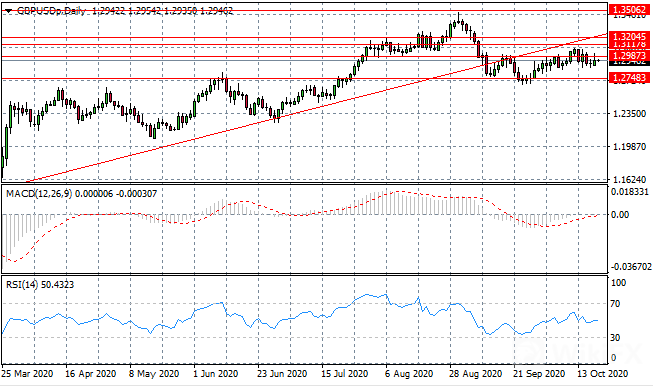
GBP/USD
The GBP/USD pair has failed at the 1.298 price level despite buying pressure in yesterdays trading session. Price action once again closed below the resistance area which is proving to be a hurdle in recent trading. Momentum indicators are neutral/bearish.
尽管昨日交易时段出现买入压力,GBP/USD仍未能达到1.298价格水平。目前价格走势再次跌破阻力区,该阻力区曾被证明是近期交易中的阻碍。动量指标为中立/看跌。
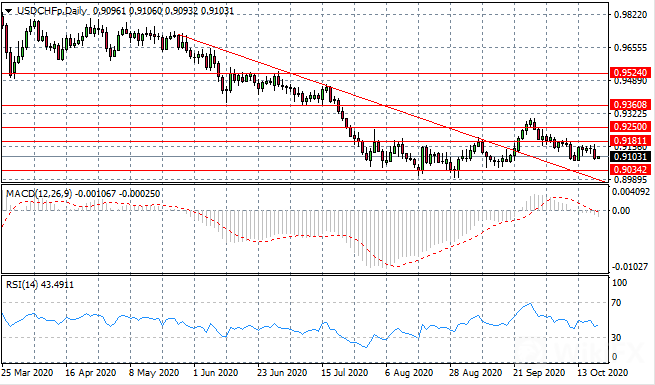
USD/CHF
The USD/CHF pair continues to consolidate within the 0.903- 0.918 range. If there is any bias, it would lean bearish especially given the longer-term trajectory of the pair and the fact that in recent trading the pair has been unable to really test the range ceiling. Momentum indicators have flattened in neutral/bearish territory.
USD/CHF仍然在0.903-0.918区间盘整。鉴于长期走势以及近期交易中该货币对无法真正测试区间上限,若出现任何偏差将倾向于看跌。动量指标在中立/看跌区域趋于平缓。
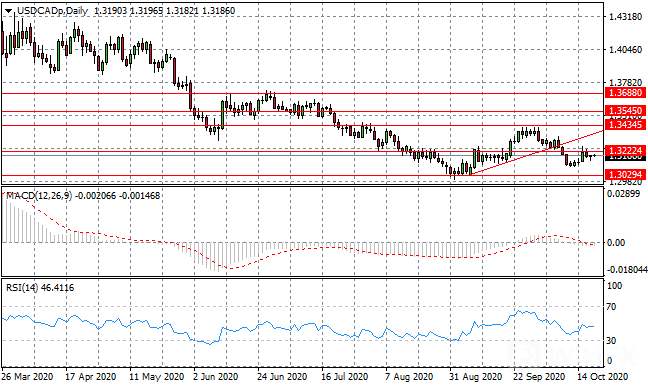
USD/CAD
The USD/CAD pair has rejected the 1.322 resistance line as the current trading range remains intact. Looking at price action it appears that buyers will make another attempt at the resistance area. Conviction will be tested. Momentum indicators have flattened in neutral/bearish territory.
USD/CAD已拒绝1.322阻力线,因此当前交易区间保持不变。从价格走势来看,买方似乎将在阻力区再次尝试,信心也将经受考验。动量指标在中立/看跌区域趋于平缓。
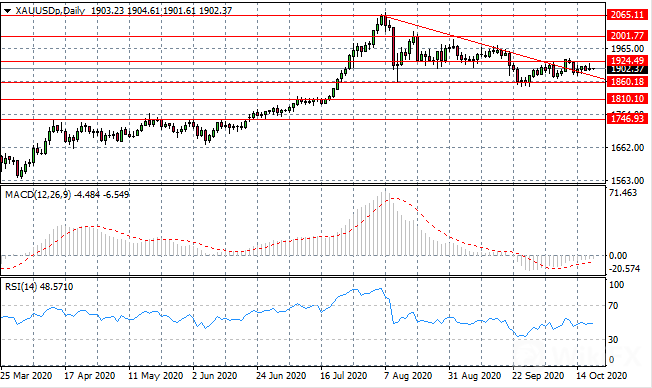
GOLD
Gold is starting to pull away from the descending trendline as the metal starts to consolidate just below the 1924.49 resistance level. Small-bodied candles indicate that neither buyers nor sellers are dominating price action. Momentum indicators have flattened in bearish territory.
随着金价开始在1924.49阻力位下方盘整,黄金开始脱离下跌趋势线。小实体蜡烛线表明买卖双方均无法主导价格走势。动量指标在看跌区域趋于平缓。
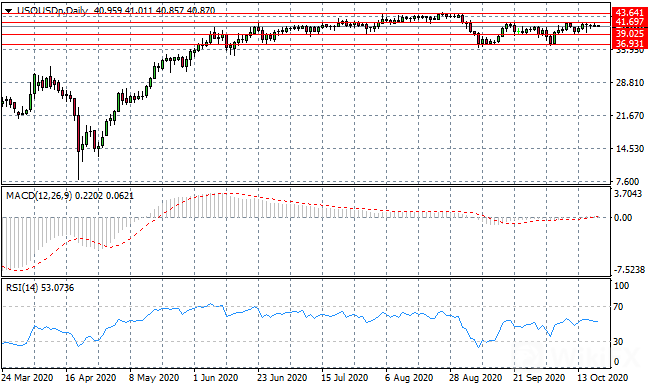
OIL
WTI rally was unsurprisingly short-lived given the lack of conviction. Small-bodied/doji candles represent the end of the bullish sentiment as neither buyers nor sellers appear willing to drive price action. The commodity will trade in range between the 36.93 and 41.69 price levels. Momentum indicators are flat.
鉴于目前缺乏信心,WTI的反弹时间很短。小实体蜡烛线代表着看涨情绪的结束,并且买卖双方似乎均无法推动价格走势。大宗商品的交易区间将位于36.93至41.69之间。动量指标持平。
In the event of any discrepancies between the Chinese version and English version of the Daily Insights, the latter shall prevail.
以上文章中英文版本若有任何歧义,概以英文版本为准。
This article is to be used only as a reference, not as a basis for trading.
策略仅供参考 不做交易依据
Leave a Reply