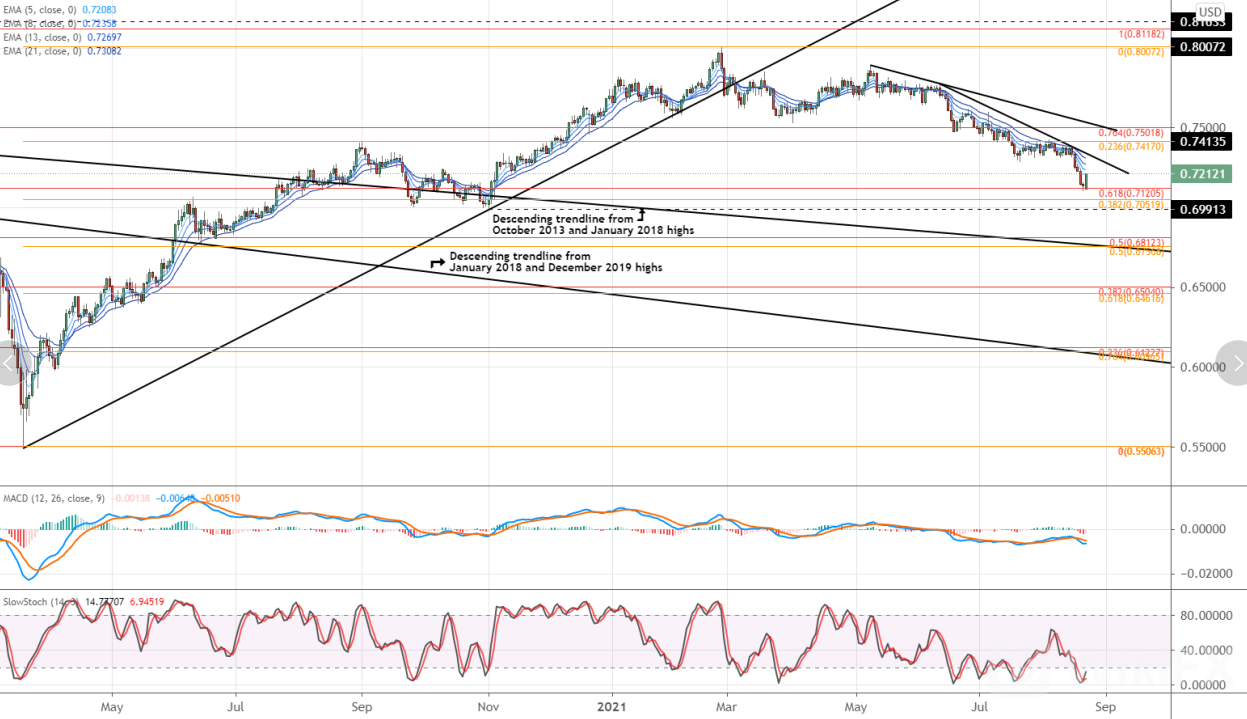
The worst may be over – at least for now. Emerging morning star candlestick patterns in AUD/USD rates speak to bottoming potential in the near-term, with the Aussie buttressed by the fact that industrial base metals – copper, iron ore, nickel – are starting to climb.
AUD/USD Analysis

AUD/USD rates are establishing a morning star candlestick pattern, a three-candle cluster that hints at a near-term bottom. Support has been found ahead of a confluence of technical support: the 38.2% Fibonacci retracement of the 2020 low/2021 high range at 0.7052; the 61.8% retracement of the 2018 high/2020 low range at 0.7125; and the November 2020 swing low at 0.6991. Retail trader data shows 70.14% of traders are net-long with the ratio of traders long to short at 2.35 to 1. The number of traders net-long is 5.66% higher than yesterday and 8.67% higher from last week, while the number of traders net-short is 3.18% higher than yesterday and 16.07% lower from last week.
- END –

Leave a Reply