-
Cryptocurrencies continue aiming higher since bottoming in July
-
Fading upside momentum in Bitcoin, Ethereum and Litecoin a risk
-
What are key technical levels to watch for in the near-term view?

BITCOIN TECHNICAL OUTLOOK
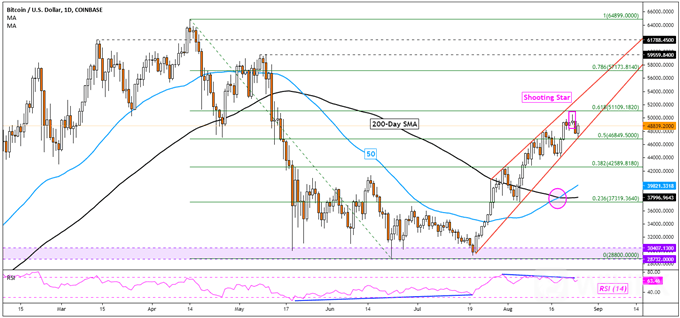
Bitcoin has climbed about 70% since prices bottomed in July. The cryptocurrency has reversed over 50% of the sharp decline witnessed from April through May. BTC/USD appears to be trading higher within a bearish Rising Wedge chart formation. While the pattern could hint at a top if prices break lower and find confirmation, BTCs near-term uptrend remains intact.
This is underscored by a bullish crossover between the 50- and 200-day Simple Moving Averages (SMAs). However, there are a couple of warning signs hinting to proceed with caution. The first is a bearish Shooting Star candlestick pattern. This is a sign of indecision, but thus far prices have failed to materially find downside confirmation. Meanwhile, negative RSI divergence shows that upside momentum is fading.
A daily close under the midpoint of the Fibonacci retracement at 46849 exposes the 38.2% level at 42589. Further losses may then place the focus back on the SMAs which could reinstate the focus to the upside. Otherwise, BTC/USD could set itself up for a retest of current 2021 lows. Resuming the uptrend exposes the 78.6% extension at 57173 towards the all-time high of 64899.
BTC/USD – DAILY CHART
ETHEREUM TECHNICAL OUTLOOK
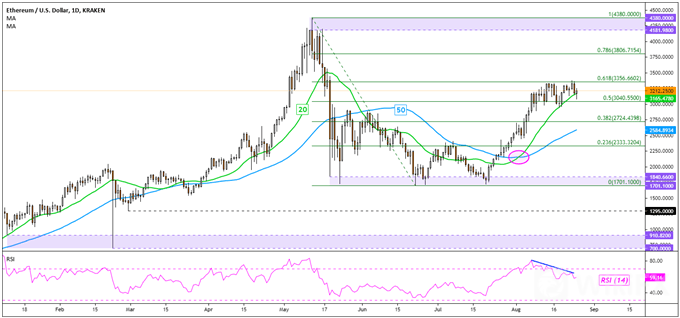
Ethereum also finds itself reversing most of the sharp decline seen earlier this year, rising about 90% since bottoming in July. Lately, momentum has been materially slowing, as highlighted by steep negative RSI divergence on the daily chart below. This could precede a turning point for ETH/USD. A confirmatory close under the 20-day SMA would expose the 50-day line.
Still, a bullish crossover between the moving averages offers an upside bias. These may come into play in the event of a turn lower, acting as key support points. Climbing above the 61.8% Fibonacci extension level would resume the uptrend. That may place the focus on the 78.6% point at 3806 towards the all-time high at 4380. Otherwise, taking out the 50-day SMA may open the door to retesting the 1701 – 1840 support zone.
ETH/USD – DAILY CHART
LITECOIN TECHNICAL OUTLOOK
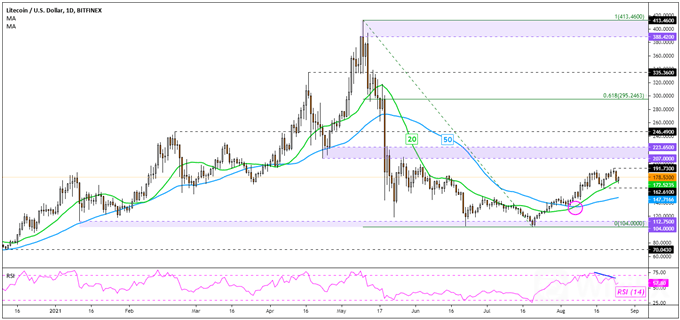
Litecoin has been struggling to find material follow-through after bottoming in July compared to Bitcoin and Ethereum. Negative RSI divergence is also present here, warning that a turn lower may be in the cards. Still, a bullish crossover between the 20- and 50-day SMAs offers an upside technical bias. Closing above immediate resistance at 191.73 exposes the 207 – 223 inflection zone towards the February high at 246.49. Dropping under the 50-day line may open the door to revisiting the 104 – 112 support zone.
LTC/USD – DAILY CHART

Leave a Reply