-
Retail traders increasingly bet that the British Pound may weaken
-
Contrarian signals hint that GBP/USD and GBP/JPY could rise
-
Sterling rectangle breakout struggles, GBP/JPY facing triangle

According to IG Client Sentiment (IGCS), retail investors are increasingly betting that the British Pound may weaken against the US Dollar and Japanese Yen. IGCS can at times be a contrarian indicator. If this trend in positioning continues, then Sterling could appreciate instead. To learn more about how you can use IGCS in your own trading strategy, check out the latest recording of my biweekly webinar series.
GBP/USD SENTIMENT OUTLOOK – BULLISH
The IGCS gauge implies that roughly 56.1% of retail traders are net-long GBP/USD. Short positioning is on the rise, gaining by 9.55% and 71.92% over a daily and weekly basis respectively. We typically take a contrarian view to crowed sentiment. Since most investors are net-long, GBP/USD may fall. However, recent changes in positioning hint that price action may favor the upside instead.
TECHNICAL ANALYSIS
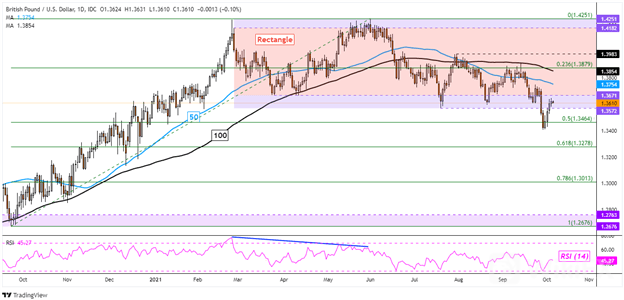
GBP/USD has been struggling to hold a breakout under a Rectangle chart formation. Prices bounced off the 50% Fibonacci retracement at 1.3464. Now, the pair finds itself retesting the former floor of the rectangle between 1.3572 and 1.3671. This range may be establishing itself as new resistance. A fall back under 1.3572 could open the door to extending losses since May. On the other hand, rising back into the body of the rectangle places the focus on the 50- and 100-day Simple Moving Averages (SMAs).
GBP/USD DAILY CHART
GBP/JPY SENTIMENT OUTLOOK – BULLISH
The IGCS gauge implies that about 35% of retail traders are net-long GBP/JPY. Downside exposure has increased by 29.70% and 4.39% over a daily and weekly basis respectively. Since the majority of traders are net-short, prices may continue rising. Recent changes in positioning are further underscoring the outlook to the upside.
TECHNICAL ANALYSIS
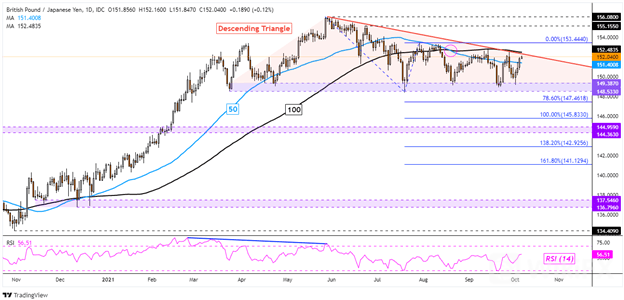
GBP/JPY appears to be consolidating within the boundaries of a Descending Triangle chart formation. In fact, the pair finds itself around similar levels seen back in late February. Price action is testing a combination of the ceiling of the triangle, as well as the 100-day SMA. A breakout higher could increasingly shift the technical outlook bullish, placing the focus on 153.444. Clearing this price exposes the May high at 156.08. Otherwise, prices may fall to the floor of the triangle, making for key support between 148.533 and 149.387. Breaking under this range exposes the 78.6% Fibonacci extension at 147.461.
GBP/JPY DAILY CHART
Source: DailyFX
Leave a Reply