-
The British Pound continues to climb the wall of worry that is the delta variant, and appears well-positioned to build on gains versus its major counterparts.
-
GBP/USD rates have turned higher within their range, while EUR/GBP rates have dropped to fresh yearly lows.
-
Recent changes in retail trader positioning suggest a mostly mixed bias for the British Pound.

KEEP CALM AND CARRY ON
At the end of July, it was noted that “now that data are showing that vaccines are working as intended – reducing tail-risk outcomes like hospitalizations and deaths – there is a cautiously optimistic mood setting in among the GBP-crosses.” That optimism has carried over into August, where Sterling has quietly been racking up gains against its major counterparts.
Now, as the calendar turns into the middle part of the month, as long as the UK economy continues to climb the wall of worry that is the delta variant, the British Pound appears poised to build on its recent gains versus the Euro, Japanese Yen, and US Dollar.
GBP/USD RATE TECHNICAL ANALYSIS: DAILY CHART (MARCH 2020 TO AUGUST 2021) (CHART 1)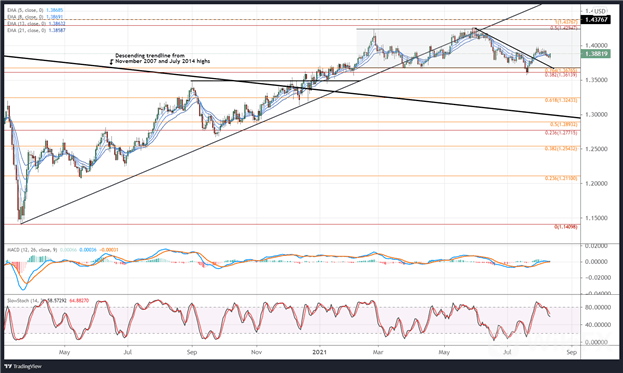
At the end of July, GBP/USD rates dropped out of the broader sideways range in place since early-February, between 1.3660 and 1.4250. But the decline in rates was quickly reversed as support come into play around a cluster of Fibonacci levels.The return to the multi-month range suggests a false bearish breakout may have transpired now that GBP/USD cleared the downtrend from the May and June swing highs.
The pair is back above its daily EMA envelope, which is returning to bullish sequential order. Daily MACD has started to turn higher through its signal line, while the drop in daily Slow Stochastics has not been met with a corresponding pullback in GBP/USD rates. The daily timeframe suggests that a bullish outside engulfing bar (or key reversal) is forming. A bottoming candle, GBP/USD rates may be poised to continue their climb towards range resistance near 1.4250.
GBP/USD: Retail trader data shows 53.61% of traders are net-long with the ratio of traders long to short at 1.16 to 1. The number of traders net-long is 2.66% lower than yesterday and 6.59% higher from last week, while the number of traders net-short is 9.90% lower than yesterday and 18.57% lower from last week.
We typically take a contrarian view to crowd sentiment, and the fact traders are net-long suggests GBP/USD prices may continue to fall.
Traders are further net-long than yesterday and last week, and the combination of current sentiment and recent changes gives us a stronger GBP/USD-bearish contrarian trading bias.
GBP/JPY RATE TECHNICAL ANALYSIS: DAILY CHART (MARCH 2020 TO AUGUST 2021) (CHART 3)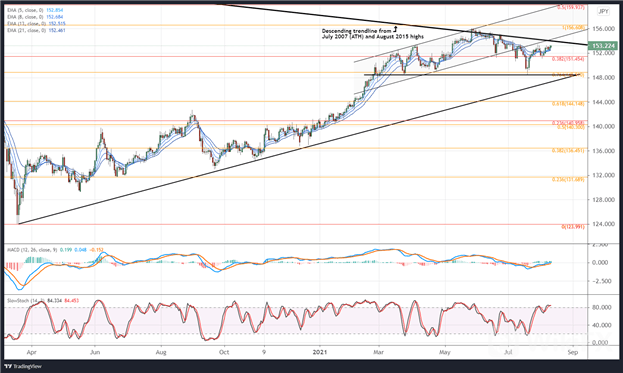
At the end of July we noted that “a morning star candle cluster has appeared, a three-candle bottoming pattern. Its possible that price action since May has been a back-and-fill after running into the descending trendline from the July 2007 (all-time high) and August 2015 highs.” This point of view remains valid. As momentum indicators turn higher, it appears that GBP/JPY is gearing up for another attempt at the descending trendline from the July 2007 (all-time high) and August 2015 highs near 154.00 in the very near-term.
GBP/JPY: Retail trader data shows 35.13% of traders are net-long with the ratio of traders short to long at 1.85 to 1. The number of traders net-long is 6.01% higher than yesterday and 7.91% higher from last week, while the number of traders net-short is 8.28% lower than yesterday and 25.34% higher from last week.
We typically take a contrarian view to crowd sentiment, and the fact traders are net-short suggests GBP/JPY prices may continue to rise.
Positioning is less net-short than yesterday but more net-short from last week. The combination of current sentiment and recent changes gives us a further mixed GBP/JPY trading bias.
EUR/GBP RATE TECHNICAL ANALYSIS: DAILY CHART (MARCH 2020 TO AUGUST 2021) (CHART 5)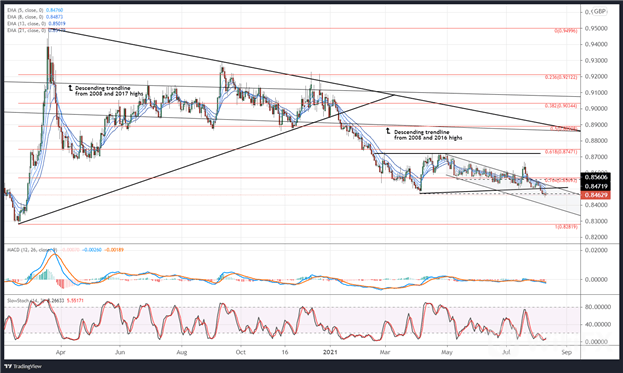
EUR/GBP rates briefly traded above descending channel resistance in place since the start of May, but the return into the downtrend – a false bullish breakout – suggest that more weakness was ahead. Now, EUR/GBP rates are trading at their former 2021 low established in April at 0.8472. Momentum indicators are pointing firmly low, suggesting that deeper losses are on the horizon for the pair. A drop just below 0.8400 could be in the cards before support is found anew.
EUR/GBP: Retail trader data shows 78.23% of traders are net-long with the ratio of traders long to short at 3.59 to 1. The number of traders net-long is 0.63% lower than yesterday and 22.52% higher from last week, while the number of traders net-short is 0.38% lower than yesterday and 3.64% lower from last week.
We typically take a contrarian view to crowd sentiment, and the fact traders are net-long suggests EUR/GBP prices may continue to fall.
Positioning is less net-long than yesterday but more net-long from last week. The combination of current sentiment and recent changes gives us a further mixed EUR/GBP trading bias.


Leave a Reply