-
The British Pound has been hampered by the latest surge in COVID-19 delta variant infections, which have traders on edge that more lockdowns are possible.
-
Both GBP/JPY and GBP/USD have rebounded from critical technical support, suggesting that further losses may be contained.
-
Recent changes in retail trader positioning suggest a mostly mixed bias for the British Pound.

DEAD CAT BOUNCE OR SECOND LIFE?
‘Freedom Day’ has come and gone for this week, but markets don‘t appear to be convinced that this marked the ’beginning of the end of the pandemic for the UK. With delta variant caseloads surging in recent weeks, the British Pound has been hampered relative to its major counterparts as traders are on edge that re-opening measures could be reversed.
But now that data are showing that vaccines are working as intended – reducing tail-risk outcomes like hospitalizations and deaths – there is a cautiously optimistic mood setting in among the GBP-crosses. While its not clear yet which way the three major pairs will shake out, clearly defined technical levels may help traders keep their risk constrained before a new trend develops for the Sterling.
GBP/USD RATE TECHNICAL ANALYSIS: DAILY CHART (MARCH 2020 TO JULY 2021) (CHART 1)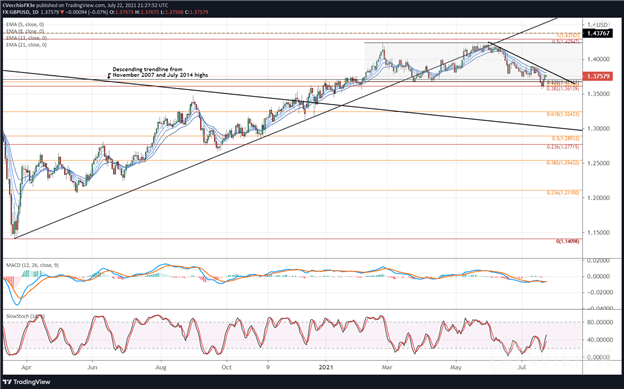
Earlier this week, GBP/USD rates dropped out of the broader sideways range in place since early-February, between 1.3660 and 1.4250, which encompassed price action since February. But the decline in rates was quickly reversed as support come into play around a cluster of Fibonacci levels. While the return to the multi-month range suggests a false bearish breakout may have transpired, GBP/USD has yet to clear the downtrend from the May and June swing highs. More time is needed to discern whether or not this is simply a counter-trend rebound or full-scale reversal (which would ultimately target the broader range high near 1.4250).
GBP/USD: Retail trader data shows 59.05% of traders are net-long with the ratio of traders long to short at 1.44 to 1. The number of traders net-long is 17.54% lower than yesterday and 1.25% lower from last week, while the number of traders net-short is 25.84% higher than yesterday and 8.38% higher from last week.
We typically take a contrarian view to crowd sentiment, and the fact traders are net-long suggests GBP/USD prices may continue to fall.
Yet traders are less net-long than yesterday and compared with last week. Recent changes in sentiment warn that the current GBP/USD price trend may soon reverse higher despite the fact traders remain net-long.
GBP/JPY RATE TECHNICAL ANALYSIS: DAILY CHART (MARCH 2020 TO JULY 2021) (CHART 3)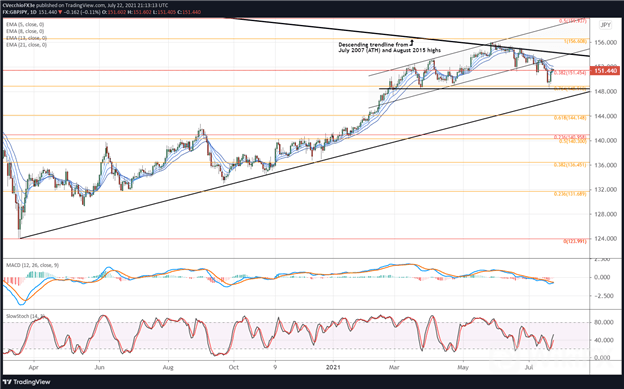
GBP/JPY rates sold off precipitously at the start of the week, dropping back to the 76.4% Fibonacci retracement of the 2020 low/2021 high range at 148.91 and briefly breaching the March swing low at 148.53. However, since Monday, it appears that a morning star candle cluster has appeared, a three-candle bottoming pattern. Its possible that price action since May has been a back-and-fill after running into the descending trendline from the July 2007 (all-time high) and August 2015 highs. Like GBP/USD, more evidence is needed before confidence in a rally to the 2020 high at 156.61 takes root.
GBP/JPY: Retail trader data shows 43.29% of traders are net-long with the ratio of traders short to long at 1.31 to 1. The number of traders net-long is 19.32% lower than yesterday and 26.22% higher from last week, while the number of traders net-short is 28.28% higher than yesterday and 15.84% lower from last week.
We typically take a contrarian view to crowd sentiment, and the fact traders are net-short suggests GBP/JPY prices may continue to rise.
Positioning is more net-short than yesterday but less net-short from last week. The combination of current sentiment and recent changes gives us a further mixed GBP/JPY trading bias.
EUR/GBP RATE TECHNICAL ANALYSIS: DAILY CHART (MARCH 2020 TO JULY 2021) (CHART 5)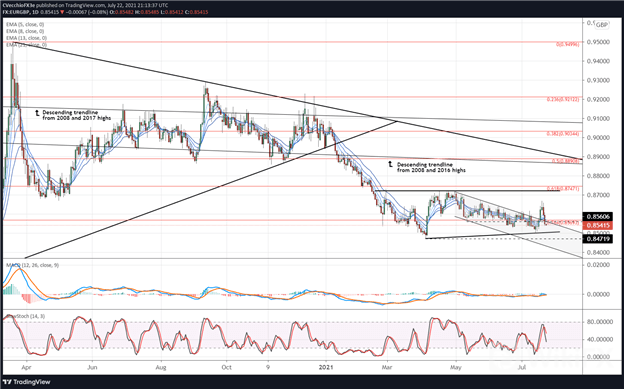
No change from yesterday: “EUR/GBP rates continue remain extremely choppy, in a sideways range effectively since late-February. In the past few days, the pair broke above descending channel resistance in place since the start of May, nullifying the perspective that ‘a return to the April low at 0.8472 is beginning to take shape.’ With momentum indicators finding no sense of agreement, this may be the one pair to stay away from over the coming days; clearer opportunities exist elsewhere.”
EUR/GBP: Retail trader data shows 66.48% of traders are net-long with the ratio of traders long to short at 1.98 to 1. The number of traders net-long is 27.77% higher than yesterday and 11.69% lower from last week, while the number of traders net-short is 37.34% lower than yesterday and 9.19% higher from last week.
We typically take a contrarian view to crowd sentiment, and the fact traders are net-long suggests EUR/GBP prices may continue to fall.
Positioning is more net-long than yesterday but less net-long from last week. The combination of current sentiment and recent changes gives us a further mixed EUR/GBP trading bias.


Leave a Reply