-
The British Pound seeing mixed performance against major counterparts
-
GBP/USD trend remains favored lower, with GBP/AUD eyeing more gains
-
GBP/CAD consolidates with upside bias, GBP/NZD faces key resistance

The British Pound is attempting to regain some lost ground against the US Dollar as of late, but the broader trend remains biased cautiously lower for GBP/USD. A combination of a ‘Death Cross’ between the 20- and 50-day Simple Moving Averages (SMAs) and the breakout through rising support from 2020 underpin a bearish outlook. Keep a close eye on the 50-day SMA, it could reinstate the focus lower if prices aim higher.
GBP/USD DAILY CHART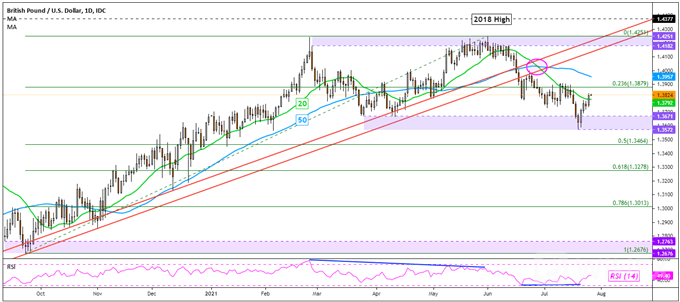
The British Pound may extend gains against the Australian Dollar as GBP/AUD continues to trade above the former 1.8453 – 1.8527 resistance zone. This is as a ‘Golden Cross’ between the 20- and 50-day SMAs continues to uphold a near-term upward bias. Immediate resistance appears to be the 123.6% Fibonacci extension at 1.8789. Keep a close eye on the SMAs in the event of a turn lower. These may act as key support.
GBP/AUD DAILY CHART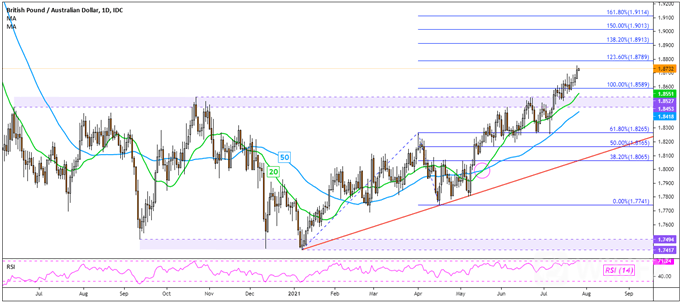
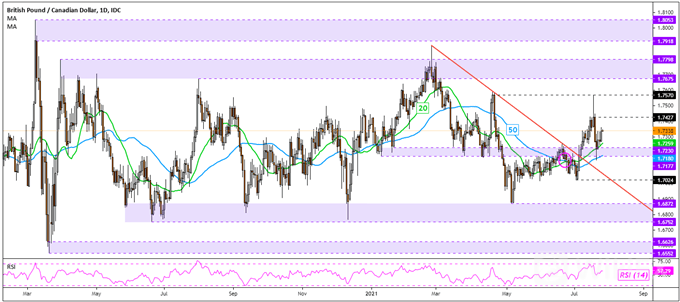
The British Pound may continue its consolidation against the Canadian Dollar. Although, GBP/CAD‘s bias could remain favored cautiously to the upside. This follows a break above a falling trendline from February and a ’Golden Cross between the 20- and 50-day SMAs. Immediate resistance points seem to be at 1.7427 followed by 1.7570. In the event of a turn lower, keep a close eye on the 1.7177 – 1.7230 inflection zone.
GBP/CAD DAILY CHART
The British Pound may also continue to aim cautiously higher against the New Zealand Dollar, with rising support from December underpinning GBP/NZDs upside bias. Immediate resistance seems to be the 1.9879 – 1.9961 inflection zone. However, keep a close eye on RSI. Negative divergence may emerge in the event prices expose the August high of 2.0271. That would be a sign of fading momentum, hinting at a turn lower.
GBP/NZD DAILY CHART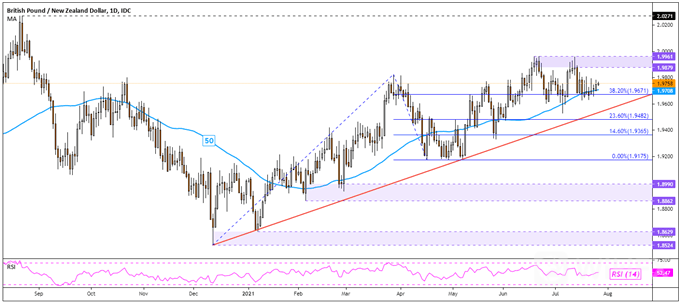


Leave a Reply