-
USD/CAD and EUR/CAD established lows in the second quarter
-
The USD/CAD has displayed some potential for a trend unfolding
-
EUR/CAD has been caught in a range, but can it break out?

USD/CAD – TECHNICAL ANALYSIS
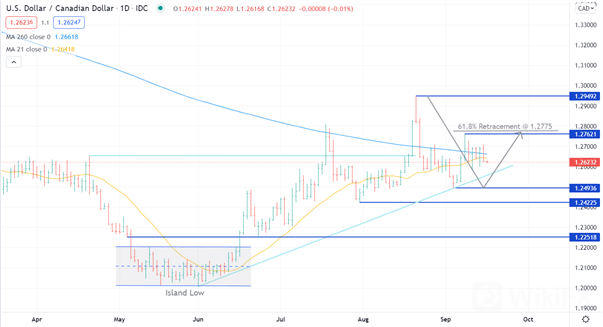
USD/CADs low of 1.2007 seen in June is part of an island low that can technically signal an ongoing reversal. Since then, the pair has consistently made higher highs and higher lows, displaying an upward trend.
Since making the high last month of 1.2949, USD/CAD pulled back down to 1.2493. This created a 61.8% Fibonacci level of 1.2775. The run-up after the 1.2493 low ended just below this level. This makes two relatively close levels of potential resistance at 1.2762 and 1.2775. The high of 1.2949 may also offer resistance.
Below the market, an ascending trend line could provide support, currently at 1.2560. Previous lows at 1.2493 and at 1.2422 could also provide support.
The USD/CAD is currently trading near the 21-day simple moving average (SMA) of 1.2642 and the 260-day SMA at 1.2662. If the 21-day SMA should close above the 260-day SMA, this could suggest some further upward momentum is unfolding.
EUR/CAD – TECHNICAL ANALYSIS
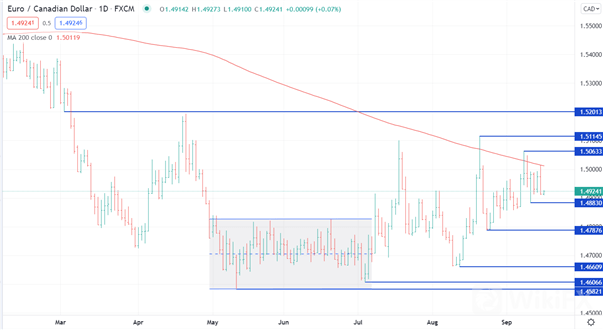
EUR/CAD broke down in March, creating a pivot point at 1.5201 on its way to the low of 1.4582. These two levels have created a broad trading range that EUR/CAD has been caught in since. From May to July the market traded in a narrower trading band. After it broke up the topside af that band, there has been a bias toward higher highs and higher lows.
As a result of this range trading dynamic, there are a series of previous highs and lows that will likely be key levels to watch. The levels of previous lows to the downside that might provide support are 1.4883, 1.4788, 1.4661, 1.4606 and 1.4582.
To the topside, the levels of previous highs that may offer resistance are at 1.5063, 1.5115 and 1.5201. Addionally the 200-day SMA is currently at 1.5012 and could offer some resistance but a close above the 200-day SMA could suggest some upward momentum.

Leave a Reply