-
Gold opened the week with a nasty sell-off but has since spent the rest of the week trying to recover.
-
At this point Gold prices are running into a big area of confluent support-turned-resistance. Will sellers use this bounce to sell into the move or do buyers have more room to run?

It‘s been a messy backdrop in Gold of recent and this week started about as badly as it could’ve for bulls. Prices crushed lower shortly after futures began trading on Sunday and this led many to call the move a ‘flash crash’ or a ‘fat finger’ event where an order was mistakenly thrown on to a market with very thin liquidity.
Whatever it was it didnt long as buyers came to the rescue and prices have spent the rest of this week clawing back that sell-off at the open.
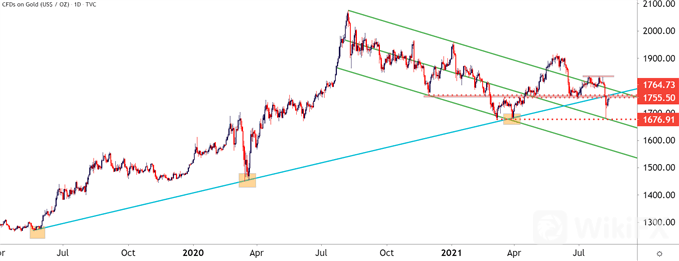
What is interesting, however, are the levels that are in play, and I had talked about this in this weeks technical forecast on Gold. At the time Gold prices had just tanked on the back of Non-farm Payrolls and price action had caught support at a trendline projection connecting the May 2019 and March 2020 swing lows. The projection of that trendline also helped to catch the low in March of this year, as Gold was setting a double bottom formation.
But with this week‘s open, that trendline was finally traded through. And at this point, there’s even potential for that prior trendline of support to become resistance.
GOLD DAILY PRICE CHART
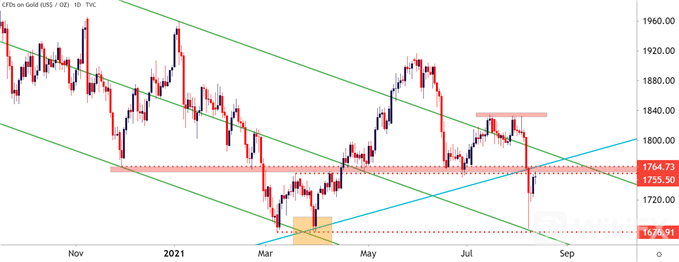
Getting a bit closer on the chart and there‘s another zone of interest in the equation, and this runs from 1755-1764. This is a batch of support-turned-resistance that I’ve been following for a while, and this is the same spot on the chart that defined the neckline of the double bottom formation that had built in March.
The double bottom was confirmed once prices broke out above this resistance in April, and in both May and June this spot on the chart helped to elicit some support.
But now – this spot on the chart is back in-play as buying pressure is softening as this zone comes back into play. This can keep the door open for bears with a resistance hold at this area of prior support.
GOLD DAILY PRICE CHART
GOLD STRATEGY NEAR-TERM: LEVELS OF NOTE
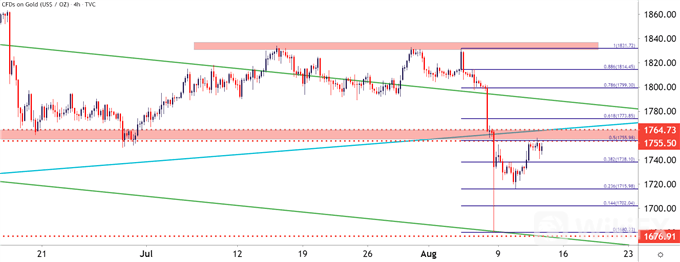
Taking a shorter-term look at the matter with greater focus on the recent sell-off and, once again, there‘s another confluent level within the 1755-1764 zone. This is the 50% retracement of the recent sell-off and it’s right at 1755.98.
With a hold below that 50% marker (along with a hold below the zone discussed earlier) the door can remain open for bearish strategies. A breach below the 38.2% retracement at 1738 opens the door for a drop down to the 23.6% marker at 1715, which helped to pick out the swing-low on Tuesday.
GOLD FOUR-HOUR PRICE CHART


Leave a Reply