-
Gold price updated technical trade levels – Daily & Intraday Charts
-
XAU/USD surges more than 6.5% as Gold defends key support at yearly lows- resistance ahead

Gold prices have soared nearly 7% off the lows after XAU/USD rebounded off critical support at the yearly lows last week. The rally is extending into initial resistance targets and while the focus remains higher, the advance may be vulnerable near-term into these next objectives. These are the updated targets and invalidation levels that matter on the XAU/USD technical charts heading into the August open. Review my latest Strategy Webinar for an in-depth breakdown of this gold technical setup and more.
GOLD PRICE CHART – XAU/USD DAILY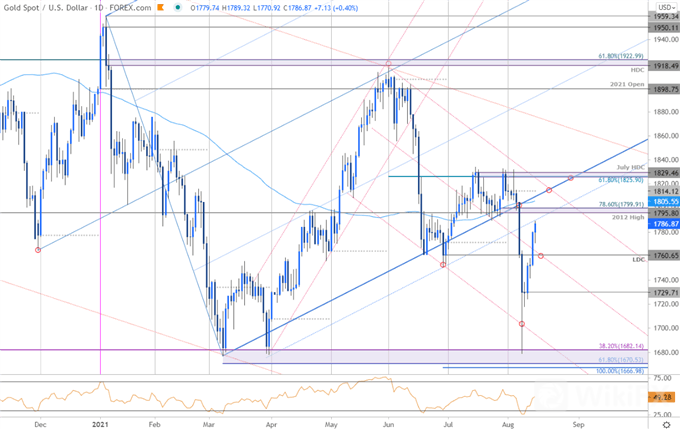
Technical Outlook: In my last Gold Price Outlook we noted that XAU/USD was, “carving out the weekly / monthly opening-range just above long-term uptrend support. From at trading standpoint, the immediate focus is on a break of the 1795-1833 range for guidance with the threat for a deeper correction while below 1841.” Gold registered a high at 1831 the following day before reversing sharply with a break below support at 1795/99 exposing a decline of nearly 7% – price briefly marked a low into critical support at the yearly lows before reversing sharply – is a low in place?
Initial resistance now stands at the sliding parallel (basically todays high) backed by key technical levels at the 2012 high/ 78.6% Fibonacci retracement at 1795/99, the 100-day moving average at 1805 and the objective monthly open at 1814. Broader bearish invalidation now lowered to the 61.8% retracement / July high-day close at 1825/29 – Ultimately, a breach / close above is needed to mark resumption of the broader uptrend.
GOLD PRICE CHART – XAU/USD 120MIN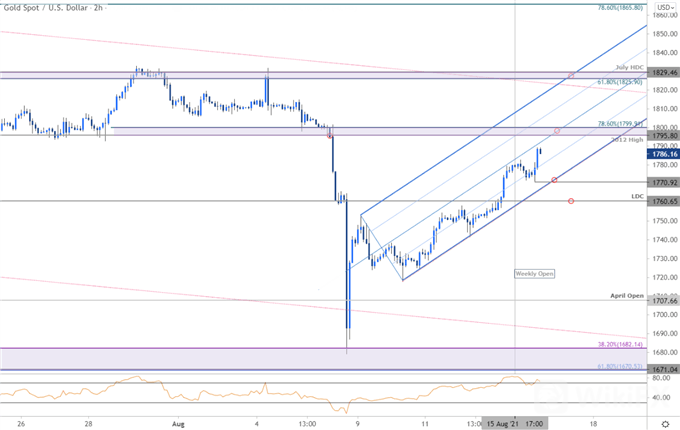
Notes: A closer look at Gold price action shows XAU/USD trading within a proposed ascending pitchfork formation with the median-line further highlighting near-term resistance into 1795/99- Initial support rests with the lower parallel / weekly opening-range low at 1770 backed by the June low-day close at 1760- both levels of interest for a possible exhaustion low IF reached. A break / close below the August low-day close at 1730 would ultimately risk another run at the lows.
Bottom line: Gold defended critical support at the yearly lows last week and the focus is on this subsequent recovery. From at trading standpoint, look for pullbacks to be limited to the 1760 IF price is heading higher on this stretch with a close above 1830 needed to shift the broader focus higher.


Leave a Reply