-
Gold prices traded a hair below the $1,800 mark as the US Dollar retreated alongside real yields
-
Traders are holding their breath for Wednesday‘s FOMC meeting and Powell’s press conference for tapering clues
-
Gold prices have broken an “Ascending Channel” and entered a technical pullback

Gold prices fluctuated at around the $1,800 mark during Tuesday‘s APAC session as traders awaited a key policy meeting by the Federal Reserve this week. A stronger-than-expected economic rebound and stellar Q2 corporate earnings strengthened the prospects for the Fed tapering stimulus and led the US Dollar higher. Against this backdrop, gold prices have pulled back from recent highs and entered a technical correction. Yet, Fed Chairman Jerome Powell may reiterate his dovish stance and emphasize that inflationary pressures are “transitory” at Wednesday’s press conference.
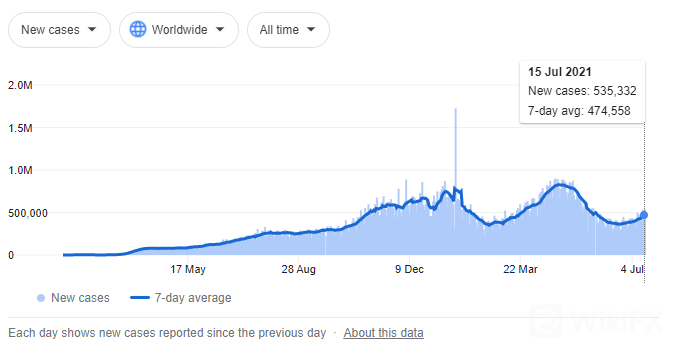
The recent rise in Covid-19 cases caused by the Delta variant around the globe may give Fed officials another good reason to consider delaying the timeline for scaling back asset purchases. Monetary and fiscal stimulus may provide medium-term support to gold prices if pandemic situations continue to worsen around the world.
New Covid-19 Cases around the World
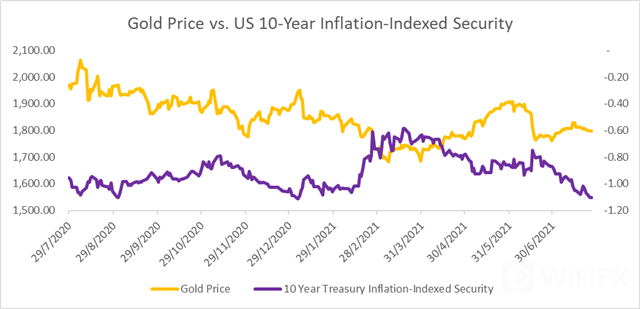
The DXYUS Dollar Index pulled lower from recent highs and extended lowering on Tuesday. Meanwhile, real yields (nominal-inflation) has hit the lowest level seen in six months, cushioning the downside for precious metals (chart below). The rate on 10-year inflation-indexed securities fell to -1.10% on Monday and is little changed today (chart below). Real yields and gold prices exhibited a negative relationshiphistorically, as rising yields mean that the opportunity cost of holding the non-interest-bearing metal is higher.
Gold Price Technical Analysis
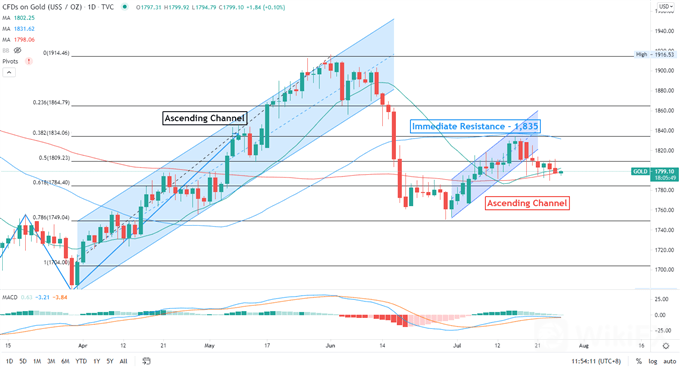
Technically, gold prices have broken an “Ascending Channel” and entered a technical pullback (chart below). An immediate resistance level can be found at $1,835, whereas immediate supports can be found at $1,800 and then $1,784. The MACD indicator remains below the neutral midpoint, suggesting that bullish momentum may be weak.
Gold – Daily Chart


Leave a Reply