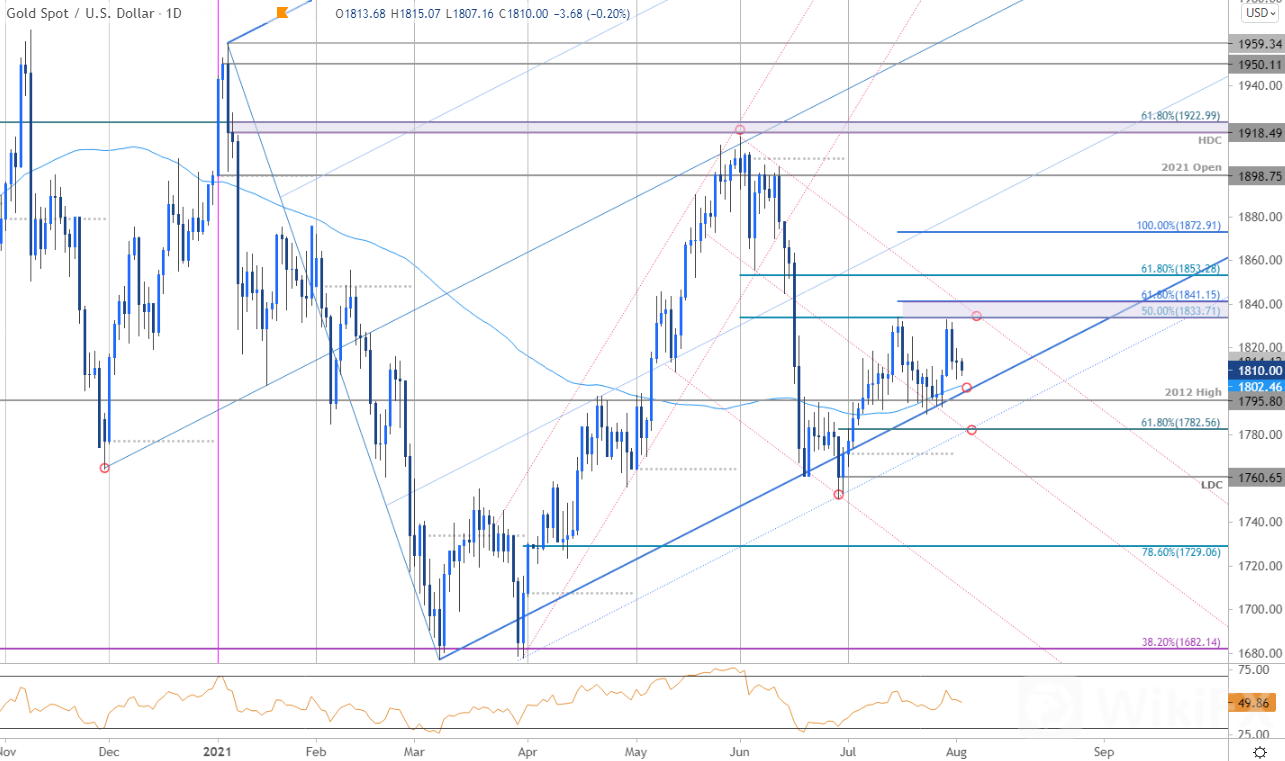
In last month's Gold Price Outlook, XAU/USD rally had extended into resistance, “at the 61.8% Fibonacci extension of the late-June advance / 50% retracement of the June decline at 1833- risk for near-term inflection here.” Bullion dropped more than 2.4% off that mark in the following weeks before defending confluence support at the lower parallel / 2012 high at 1795 into the close of July. That recovery has once again failed at the 1833 resistance zone and a breach / close above the 61.8% extension at 1841 is still needed to fuel the next leg higher in price.
GOLD PRICE CHART – XAU/USD DAILY

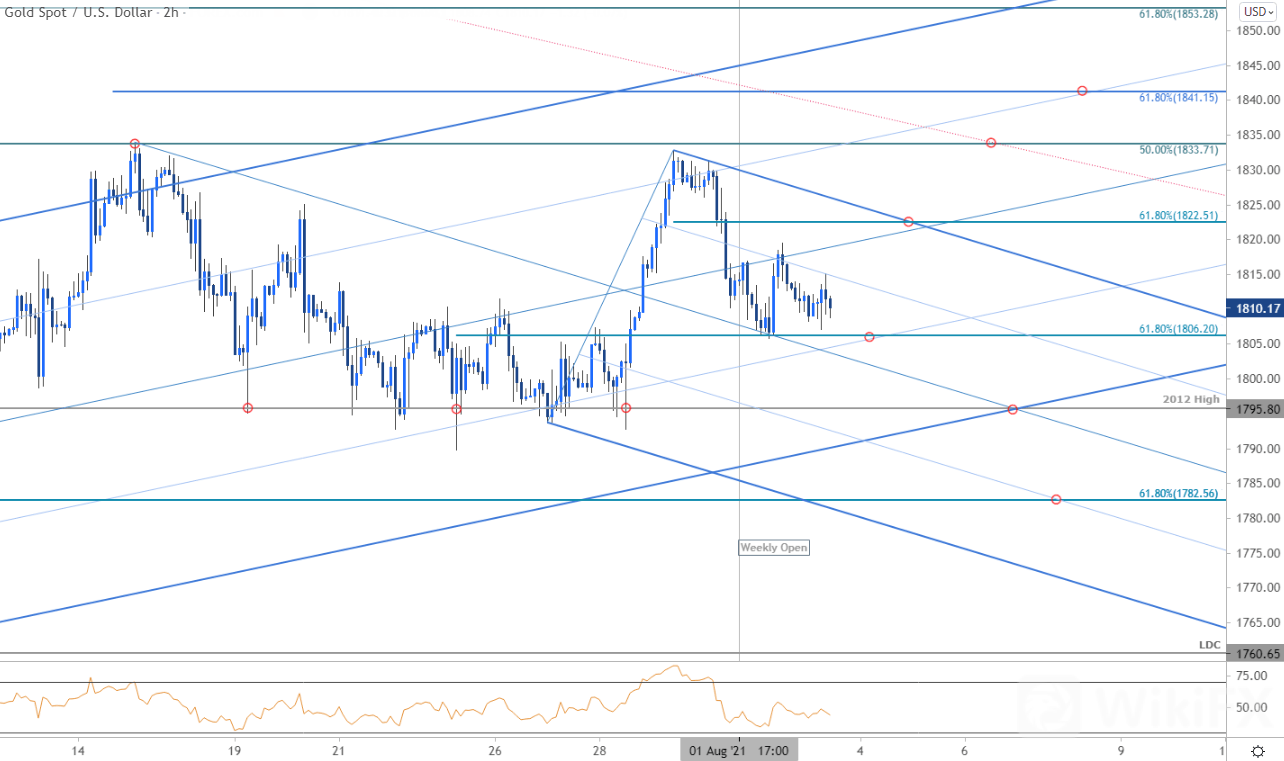
GOLD PRICE CHART – XAU/USD 120MIN

A closer look at Gold price action shows XAU/USD trading within a proposed descending pitchfork formation extending off the July highs with the weekly / monthly opening-range taking shape just above initial support here at the 61.8% retracement late-July advance at 1806. Initial resistance stands at the upper parallel / 61.8% retracement at 1822 with a break lower from here again exposing 1795 and the 61.8% retracement of the June advance at 1782- both zones of interest for possible downside exhaustion IF reached.
Bottom line: Gold is carving out the weekly / monthly opening-range just above long-term uptrend support. From at trading standpoint, the immediate focus is on a break of the 1795-1833 range for guidance with the threat for a deeper correction while below 1841. Ultimately a larger setback may offer more favorable entries with a breach / close above yearly trendline resistance needed to mark resumption of the broader uptrend. Keep in mind US Non-Farm Payrolls (NFP) are on tap into the close of the week- stay nimble here.
Stay tuned!

Leave a Reply