-
Retail traders are increasingly betting the Japanese Yen may weaken
-
Upside exposure is increasing in pairs such as USD/JPY, AUD/JPY
-
This is measured by IGCS, which can at times be a contrarian indicator

According to IG Client Sentiment (IGCS), retail traders appear to be increasingly betting that the Japanese Yen could depreciate against currencies such as the US Dollar and Australian Dollar. IGCS can at times be a contrarian indicator. If this trend in positioning continues, the Yen could stand to benefit instead. To learn more, check out this weeks recording of my webinar above.
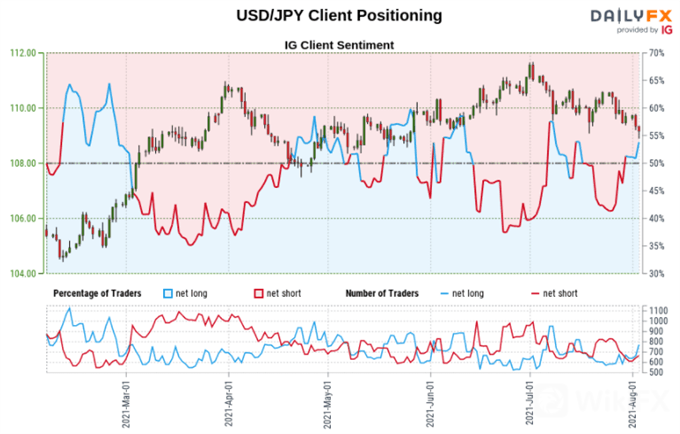
USD/JPY SENTIMENT OUTLOOK – BEARISH
The IGCS gauge implies that roughly 57% of retail traders are net-long USD/JPY. Upside exposure has increased by 8.59% and 28.31% over a daily and weekly basis respectively. The fact that investors are net-long hints that prices may continue falling. This is further underscored by recent changes in sentiment, offering a stronger bearish contrarian trading bias.
TECHNICAL ANALYSIS
USD/JPY could be vulnerable to further losses in the near-term after a ‘Death Cross’ emerged between the 20- and 50-day Simple Moving Averages (SMAs). This follows a combination of a Bearish Engulfing candlestick pattern, and the break under rising support from January. That has not exposed the 200-day SMA below, which may reinstate the focus to the upside down the road.
USD/JPY DAILY CHART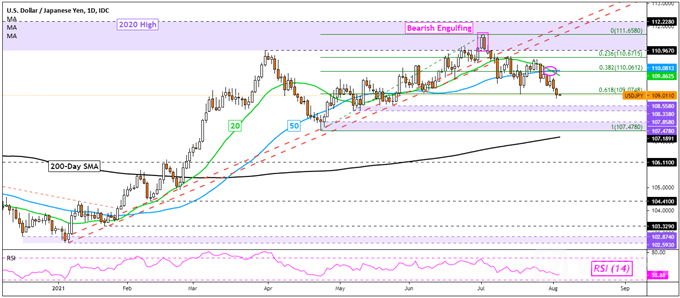
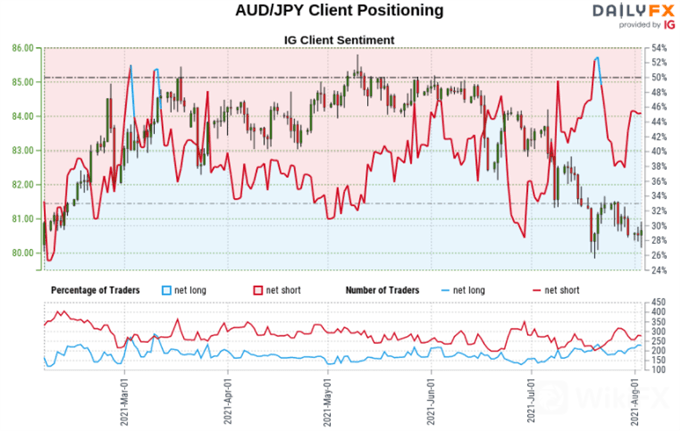
AUD/JPY SENTIMENT OUTLOOK – BEARISH
The IGCS gauge implies that about 47% of retail traders are net-long AUD/JPY. Downside exposure has decreased by 15.33% and 22.36% over a daily and weekly basis respectively. The fact that traders are still net-short suggests that prices may rise. But, recent shifts in sentiment warn that the price trend may favor the downside.
TECHNICAL ANALYSIS
Despite recent consolidation, the broader technical bias may remain tilted lower for AUD/JPY. That is because prices seem to have confirmed a break under the 200-day SMA, which followed a ‘Death Cross’ between the 20- and 50-day SMAs. Still, resuming the near-term downtrend entails clearing the key 79.844 – 80.337 support zone. That would expose the 61.8% Fibonacci retracement level at 77.981.
AUD/JPY DAILY CHART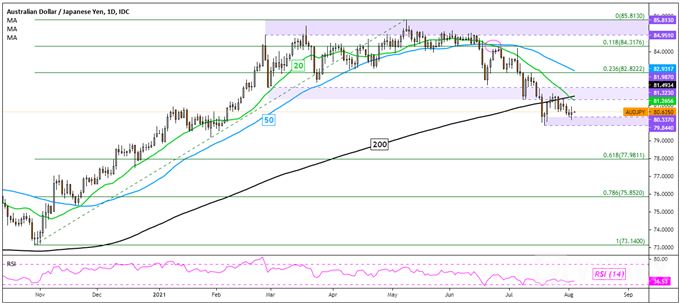


Leave a Reply