-
The US Dollar is starting the week with a bounce from a key support zone.
-
This follows last weeks pullback, that started around inflation data but hastened on Friday after the release of consumer sentiment numbers.

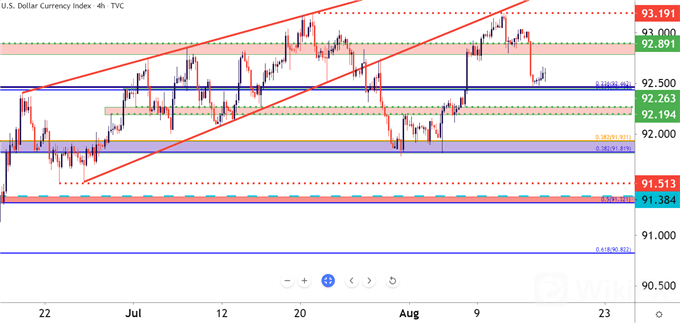
The US Dollar has finally found some element of support after the pullback that developed last week. Prices in DXY had pushed up for a test of the four-month-high ahead of the release of July inflation numbers. And once again, inflation came out well above the Fed‘s 2% target. But, the beat on the expected number was milder than prior months, leading to the hope that some of the recent inflationary flare was/is transitory in nature. And prices in USD pulled back after another 5% inflation print, likely due to some relative cooling in the print’s release v/s the expectation.
In USD, prices initially pulled back to the zone around 92.89 and after a mild bounce, sellers drove down to another big area of support around 92.46 on DXY. In this area are two different Fibonacci retracements: The 23.6% retracement of the 2020 sell-off and also the 23.6% retracement of the Q1 bullish trend.
US DOLLAR FOUR-HOUR PRICE CHART
EUR/USD BOUNCE FROM LONG-TERM RANGE SUPPORT
That pullback in USD came at a very opportune time for EUR/USD: Right as the pair was testing its 2021 low at 1.1704. Around that low are a series of Fibonacci levels that have, so far, put in a strong sense of range support in the major pair through this years trade.
EUR/USD DAILY PRICE CHART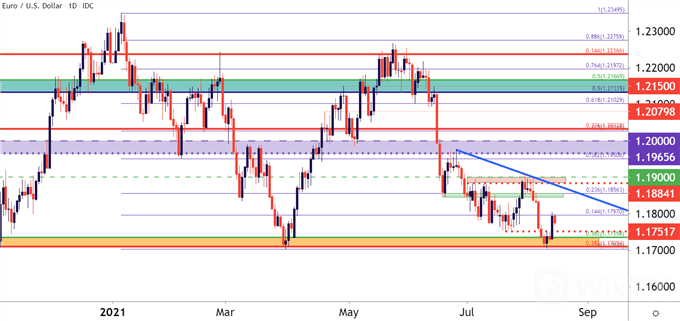
Last weeks bounce pushed the pair up to another Fibonacci level of note, with the 14.4% retracement of the 2021 trend plotted at 1.1797 catch the recent high.
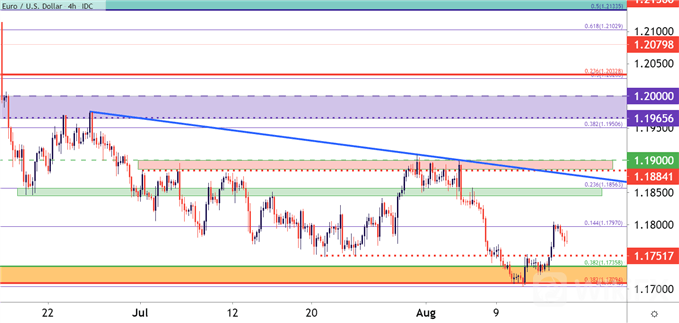
But, there may be some bullish trajectory yet as the four chart below illustrates a sequence of recent higher-highs and lows. The psychological level at 1.1750 is of interest for higher-low support potential. Perhaps more enticing to longer-term bearish scenarios is resistance potential around the 1.1850 area; and if that cant hold, the prior resistance zone from 1.1885-1.1900 remains of interest.
EUR/USD FOUR-HOUR PRICE CHART
GBP/USD: HELD BACK AT KEY FIB – BREAKOUT POTENTIAL
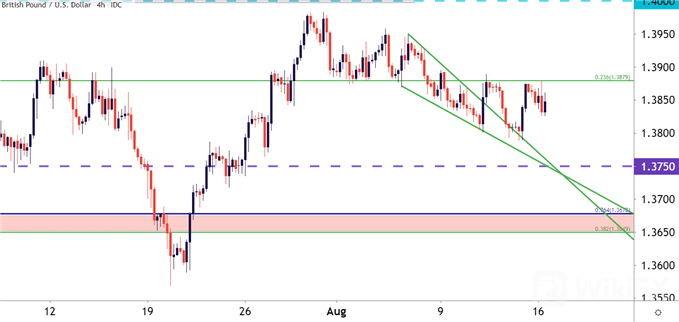
On the short side of the US Dollar, GBP/USD remains attractive. The key point of emphasis at the moment appears to be the same Fibonacci level thats been in-play since back in February, and this is the 23.6% retracement of the September-June major move.
More recently, GBP/USD formed a falling wedge formation, which is often approached with the aim of bullish breakouts. And prices did break out last week – but they didn‘t get very far as Fibonacci resistance came into play to hold the advance. This happened again after this week’s open.
This keeps the door open for bullish breakout potential at that level of 1.3879 in GBP/USD.
GBP/USD FOUR-HOUR PRICE CHART
USD/CAD HOLDS AT A BIG SPOT
Canadian inflation numbers are released on Wednesday so we‘ll likely see USD/CAD stay on the move. Of late, the pair has held up through a key support test at a really big spot on the chart around 1.2500. But, there’s also a trendline that was confluent with that price and, so far, that zone has held.
Short-term price action is now nearing a test of near-term range resistance, plotting at around 1.2588. A breach above that opens the door to the next near-term level at 1.2622, a longer-term Fibonacci level thats marking the topside of the longer-term support zone.
USD/CAD FOUR-HOUR PRICE CHART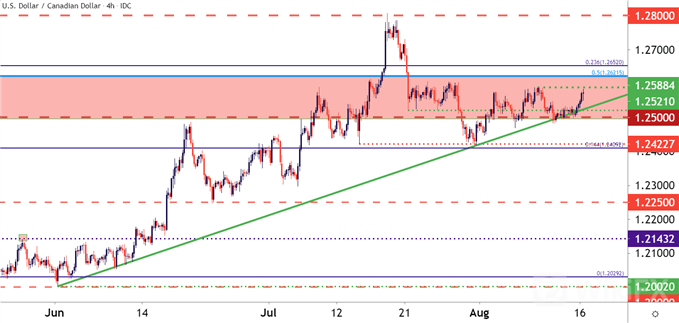


Leave a Reply