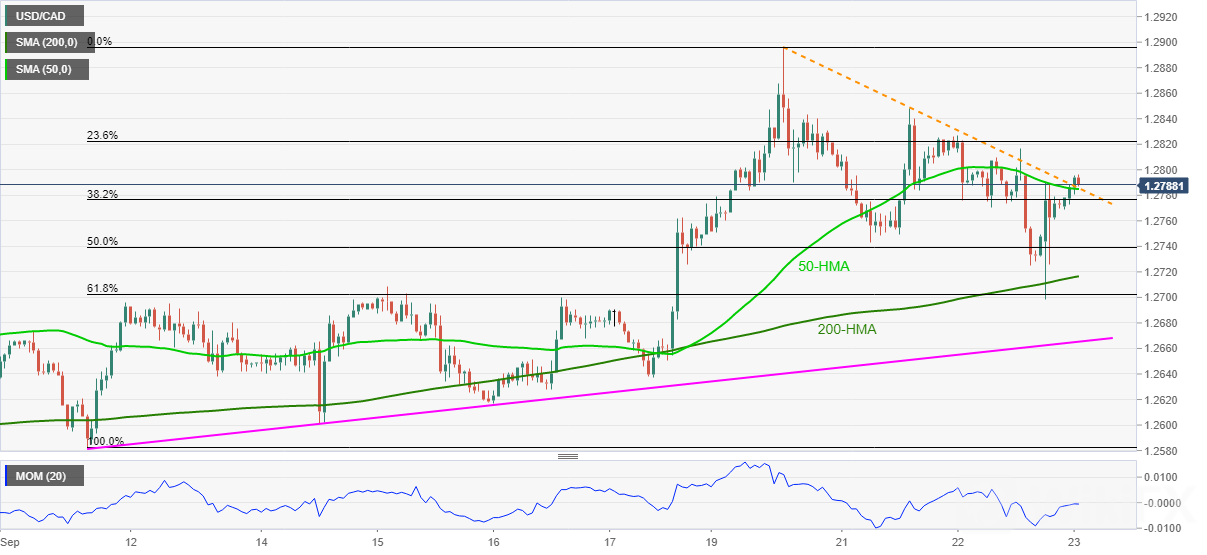
USD/CAD Price Analysis: Crosses 1.2785 resistance to snap two-day downtrend
USD/CAD regains upside momentum after marking two-day losses.
Upside break of 50-HMA, weekly falling trend line joins firmer Momentum line to favor buyers.
200-HMA, 61.8% Fibonacci retracement restrict bears entry before fortnight-old support line.
USD/CAD pierces short-term key hurdle to the north as bulls attack 1.2800 threshold, up 0.14% intraday near 1.2795 during early Thursday.
In addition to a sustained break of 50-HMA and weekly descending trend line breakout, a firmer Momentum line adds to the bullish bias for the USD/CAD.
Hence, 1.2850 is on the cards ahead of the monthly top near 1.2900.
However, any further upside past 1.2900 will not hesitate to challenge the yearly peak of 1.2949.
Alternatively, the resistance-turned-support near 1.2785 restricts immediate downside of the USD/CAD prices ahead of the 200-HMA level surrounding 1.2715.
Also challenging the USD/CAD sellers is 61.8% Fibonacci retracement of September 10-20 upside, as well as a two-week-old horizontal area, respectively near 1.2700 and 1.2695.


Leave a Reply