Last week it was discovered that the “ninja” closed the previous trading week session with a strong consolidation in price action movement. Where The ratio of buyers and sellers was approximately in direct proportion. Hence a tight sideways movement in price exchange surfaces the entire USDJPY Market. With this in mind, the majority of market players are on the outlook for a spike in the volatility Nature of the pair. And If at any moment the presence of a genuine volatility Indicator overshadow the consolidation force the market is currently undergoing. The price of the market could tend to move in the favour of the dominating key market participants.
What To Expect For This Week In USD/JPY Market
The Japanese Business sentiment index( BSI) which measures the sentiment of the large manufacturing industry in Japan is said to be released (on Monday 13th of September 2021) with a positive expectation on the side of economic analysts and the interbank markets. However, the last reported update for the BSI data claims a recording of -1.4 which was believed to be a negative performance. In response to this report, a bullish motion could be welcome in the market if at all the reported data outweigh the previous release or yield a number above zero, on the flip side a bearish move will be the next trending move if the BSI data should cross below the previous marked level. With a less focus on the US Bureau of Labor Statistics which published the Producer Price Index (PPI) data for August. In Addition to this report market players will hold a close look at the performance of Wall Street's primary indexes and the US T-bond results.A report from FX street claims that the US Dollar Index is down by 0.12% in the last trading day at 92.41% and the S&P 500 assets are rising by 0.43%. Yet it's unlikely that the price of the dollar will meet an appreciating buyer's presence. USD/JPY Technical Analysis
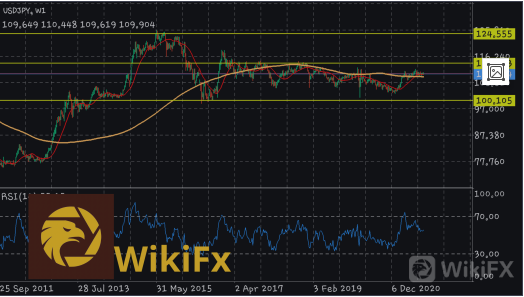
Weekly time frame

From the weekly time chart, the USD/JPY pair was observed in a strong market consolidation which forces the price of the market to move in a straight horizontal smaller candlesticks range along with the 109.904. Whereas the trading bias on this time frame represents a bearish price action. While volatility is on the lower level. A weaker than expected change will be expressed in the overall nature of the market structure.
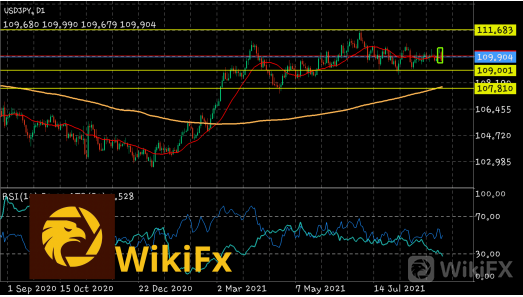
Daily time frame

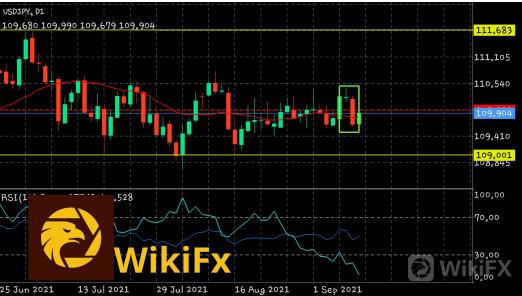
To be more accurate in this analysis the USD/JPY pair had a bearish candlestick reversal pattern ( Evening star) appearance on the daily time frame, meaning the likeness of price moving in a negative direction is very much weighted. Besides 200MA indicates buyers performance for the last 200 days candlesticks which proclaim that the tendency of price reversing back towards the higher moving average is on the highest degreeWithout much ado positions, traders can be set to enter the market whenever the price closes below the evening star. As this can serve as the most profitable means of taking a position.
4-hour time frame

Swing traders on the other hand should have a keen interest in regulating the ranging moves present in the 4-hour time frame. With deep thoughts on this time frame, price will hit the previous swing high before pulling to the downside, hence the cycle of the ranging will be met with a breakout in price.
In conclusion
Moving further to the start of the second trading week of September the pair could likely encounter a mil rising in volatility. Where a favourable move could be on the side of the sellers. https://jump.wikifx.com/gip?gip=D4CCBB335B4E8424
Leave a Reply