
In this article, youll learn successful forex trading strategies by experts who advise the trading desks of the largest banks and hedge funds in the year, including being a finalist in The Technical Analyst Award in 2019. The minds that put together this article are CMT (Chartered Market Technical), CFTe (Chartered Financial Technician) and CFA (Chartered Financial Analyst) qualified and pedigree comes from the largest and most successful trading firms.
In the strategies below, we list 3 strategies that when combined, provide a really successful forex trading strategy. They can be used by themselves, although their strength comes when used in conjunction with each other.
There are many ways to draw support and resistance lines. Personally, we prefer to draw horizontal lines vs diagonal lines. The reason for this is because diagonal lines are much more subjective vs horizontal lines. Remember – how strong a support/resistance line is determined by how many people are looking at the same level. So different brokers have different price feeds – how does this affect the accuracy of horizontal lines and diagonal lines?
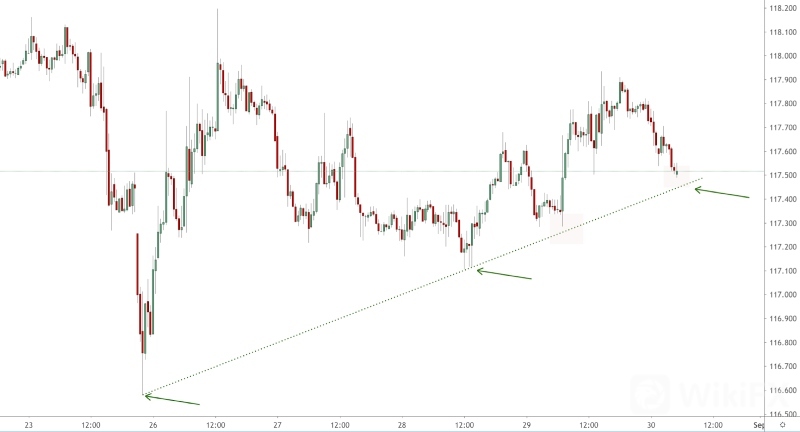
Diagonal support by broker #1:

Notice that right now, it shows that the price is right on support and we should be expecting a bounce? This is determined by the spikes of each candle that has bounced off the ascending diagonal support line as pointed out by the arrows.
Now, what if the spikes are just slightly higher/lower by a small margin? Heres the price feed of another big broker:
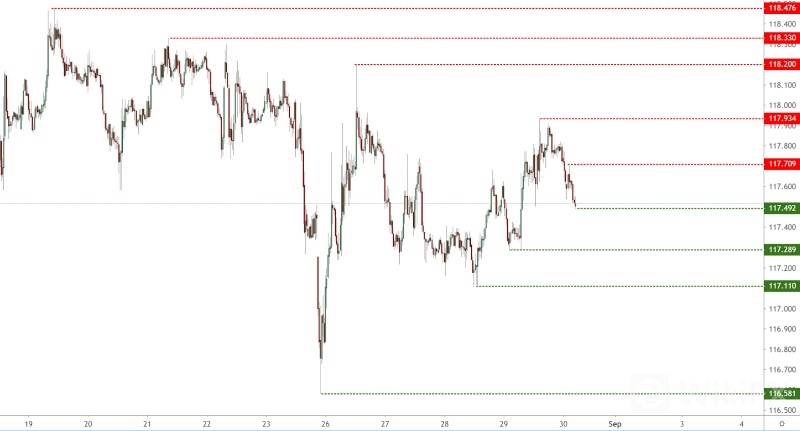
Diagonal support by broker #2:
Notice that there are only 2 bounces vs 3 on the first broker? And now the ascending support line is not saying that price will make the bounce anymore. In fact, the price is a bit far from the ascending support and we shouldnt be expecting a bounce yet.
This is a result of different price feeds leading to different interpretations.
Verdict: Diagonal support/resistance lines are not reliable for accurate position entries. Instead, they are better used to gauge the momentum of the market (higher lows = bullish momentum = better for buy entries).
So.. Horizontal support/resistance lines are better?
Yes, they are. There are 3 ways to accurately identify horizontal support/resistance lines. The trick is in the filtering. If you don‘t filter your lines, you’ll end up with something like this:
That‘s a lot of support/resistance lines and imagine if a strategy is “buy on support, sell on resistance”. You’ll end up losing a lot of money.
So, how do I filter these? This is where our 3 strategies for picking the best support/resistance levels come into play.
Strategy 1: Multiple Swing Low/High Support
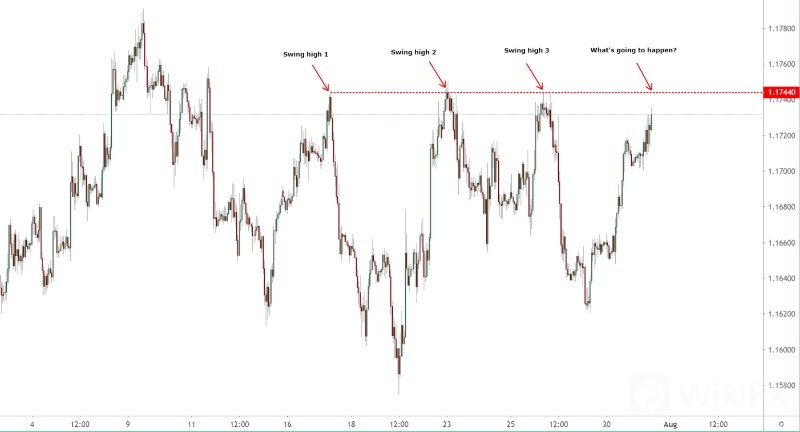
One trick is to look for a horizontal level that has prices reacting off multiple times. In the picture below, we can see that price has already reacted off 3 times at this key level. So now that price is approaching it a 4th time, what is likely going to happen?
The more times the price reacts off a certain level, the stronger that level is. So in the picture below, we can see that price indeed reacts off that strong resistance level and drops strongly.
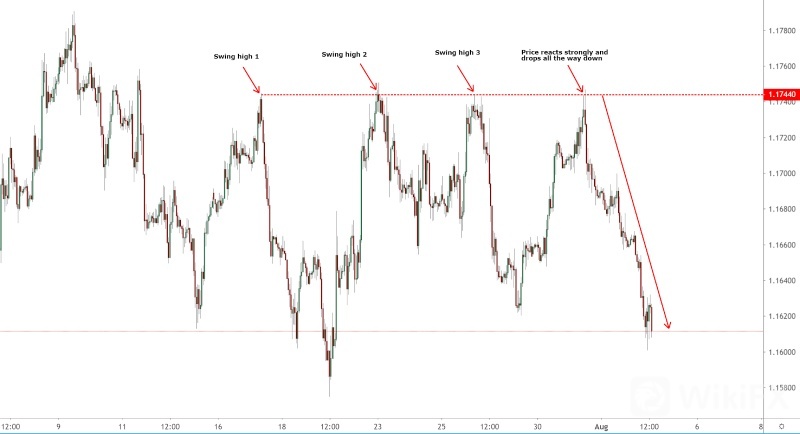
The rule of thumb is to at least wait for 3 swing highs or swing lows to line up nicely before taking a trade on the 4th time price touches the horizontal support/resistance level.
Strategy 2: Hidden Stochastic Support
Now there‘s a popular indicator being used to trade bounces and reactions – and that’s the Stochastic Oscillator indicator. What many people dont know is that the standard 20% support and 80% resistance lines are actually lies told to the public. There are actually hidden support/resistance levels for every stochastic indicator.

Remember the trade we described above? On top of using multiple swing high resistance levels to take trades, you can load up Stochastic oscillator and see if there is a hidden resistance level.
We have drawn the “fake” Stochastic oscillator setting of 80% in orange. If you had used that level, you would have missed every single reaction. But if you used 94.15% (the hidden level in this example), you would have got every single trade spot on.
Each market would have a different hidden setting. So you‘ll need to draw horizontal lines like we did and see where prices are reacting off to find the hidden resistance level on Stochastic oscillator. Once you find that, and you combine it with the 1st strategy of finding horizontal levels with multiple swing high/lows, you’re on to a very strong trading strategy.
Strategy 3: Hidden RSI Support/Resistance
One of the most popular indicators is the RSI indicator. The default setting many people use is 30% as support and 70% as resistance. Similar to the Stochastic indicator above, there are many hidden levels of support and resistance you can consider which will give you an advantage.
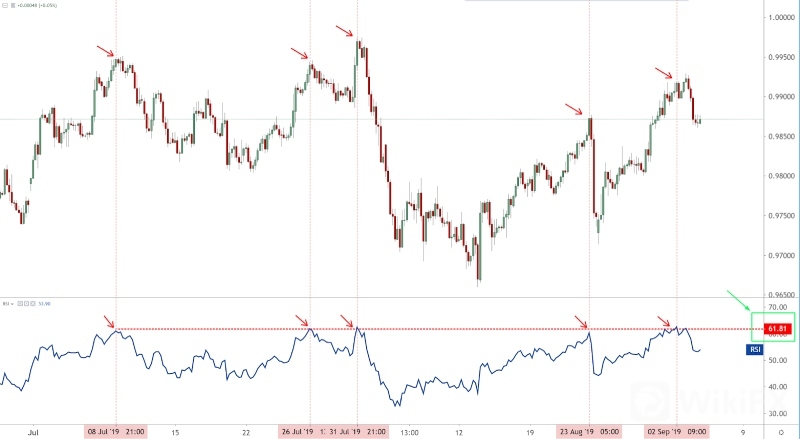
In the example above, we can see that the price tends to react very nicely each time RSI hits the 61.8% resistance level. This is not the 70% that most people highlight. If we had waited for 70% resistance, we would have missed almost every one of these moves.
By itself, this hidden RSI resistance is a fantastic strategy to use. However, when combined with Strategy 1 (multiple swing high/low) and Strategy 2 (hidden Stochastic support/resistance), it provides a really high probability trading setup.
In the world of trading, it‘s important to surround yourself with people. Not normal people, but experts who can guide you on your trading journey and constantly ensure you are aligned correctly. Asking questions can lead you down the wrong path if the wrong people answer you – which is why it’s important to exercise discretion and pick the correct trading communities.
Axi has a really good and exclusive trading group, however, you‘ll need to have an account to qualify for entry – you know what they say, good things don’t come easy. We run competitions, have constant market updates and it is actually one of the few places where you can engage with really top-notch analysts and traders there 24/5 around the clock.

Leave a Reply