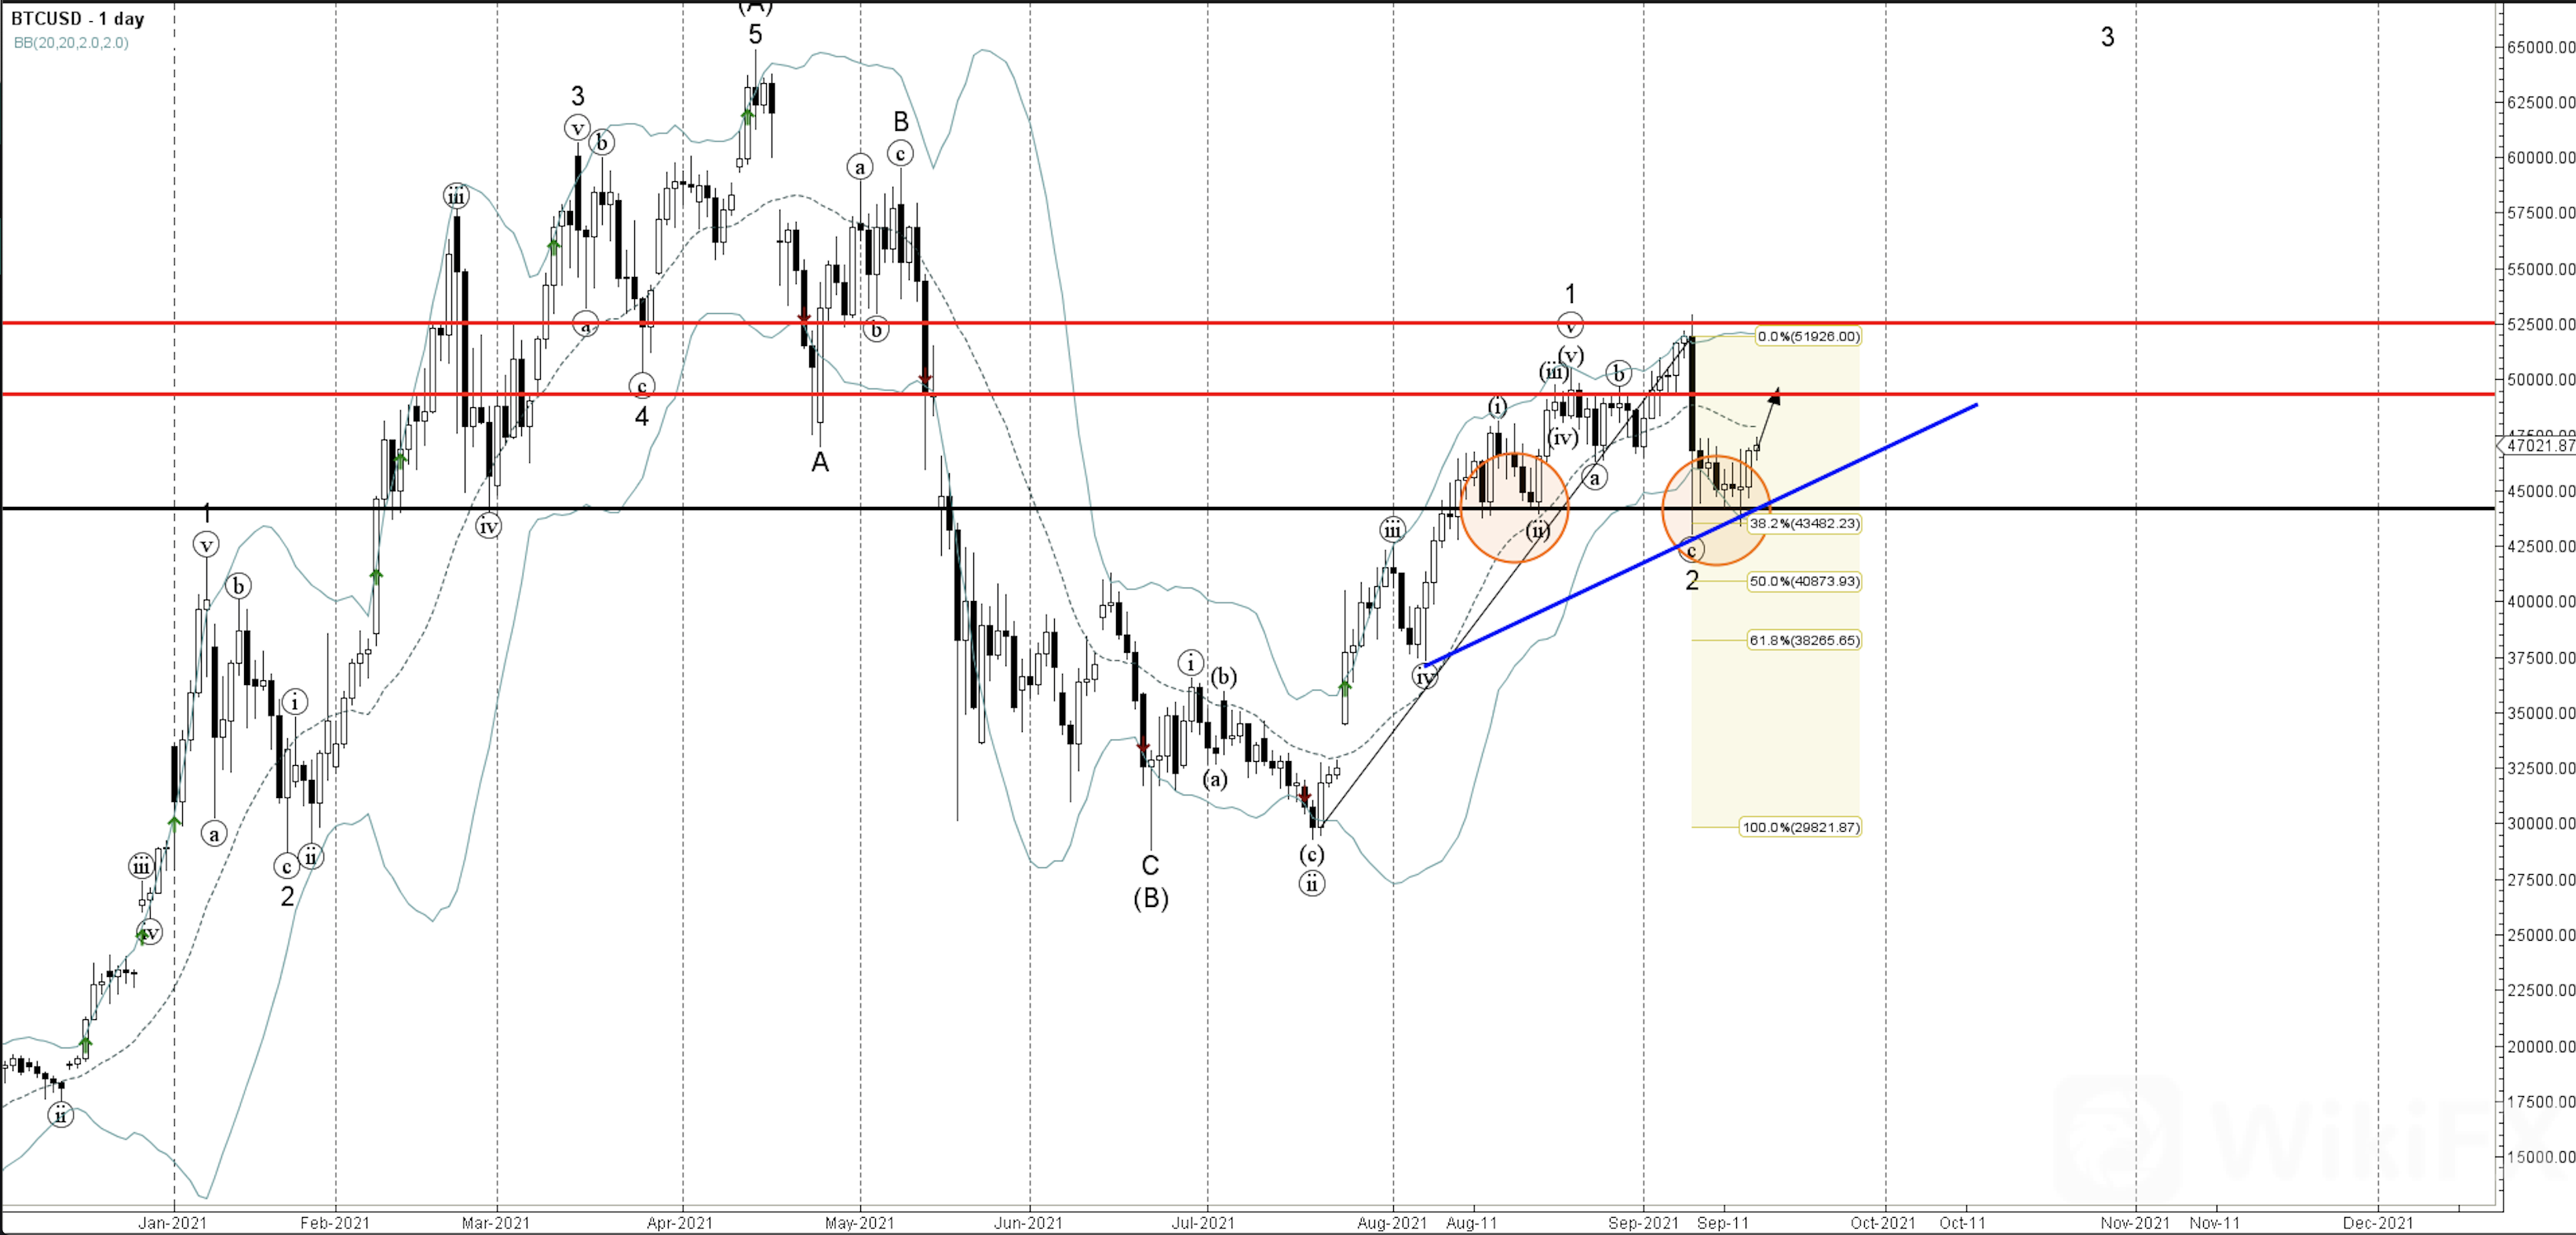
Bitcoin cryptocurrency continues to rise after the price reversed up from the combined support zone located at the intersection of the following Bitcoin support levels: the support level 44190.00 (which has been steadily reversing Bitcoin from the start of August, as can be seen from the daily Bitcoin chart below), lower daily Bollinger Band, support trendline from August and the 38.2% Fibonacci correction of the previous sharp upward impulse from the start August.
The upward reversal from the aforementioned support zone created the daily Japanese candlesticks reversal pattern Long Legged Doji, which is aligned with the active short-term impulse wave 3, which started earlier from the same support level 44190.00.
Given the favourable Bitcoin sentiment as seen across the cryptocurrency markets today , Bitcoin is likely to rise further, in the active impulse waves 3 and (C), toward the next round resistance level 50000.00 – the breakout of which can lead to the test of the earlier reversal high at 52500.00.
—————–
As a reminder, WikiFX is ready to help you search the qualifications and reputation of platforms to protect you from hidden dangers in the risky industry!
For more details about Forex, Download WikiFX now!
Android: cutt.ly/Bkn0jKJ
IOS: cutt.ly/ekn0yOC
Leave a Reply