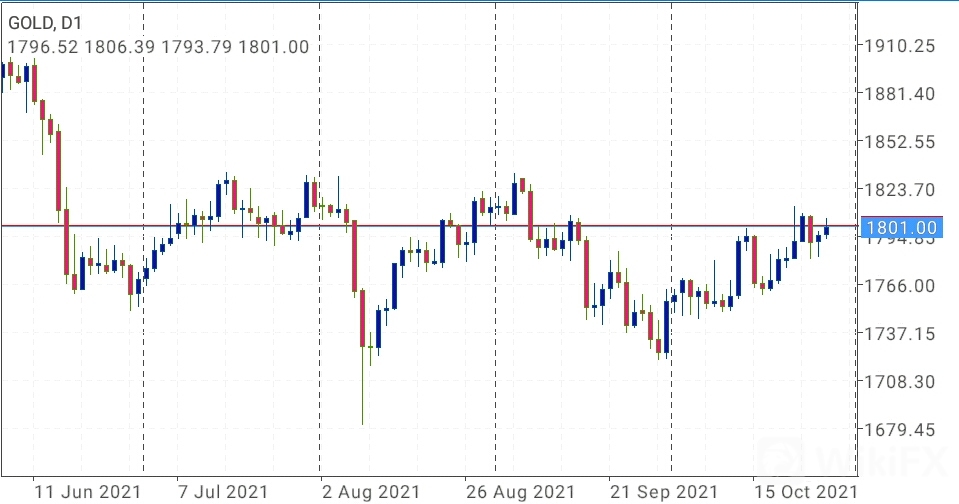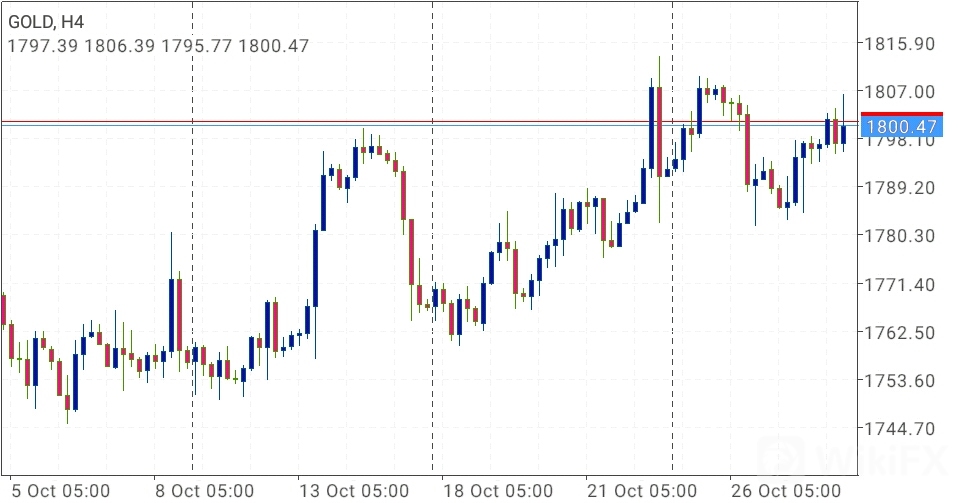
The trend of gold on the daily chart is in line with technical requirements. After falling below the trend line support overnight, it retreated to near the expected support of 1782, and then the market stopped falling and rebounded as expected, and it was again in line with expectations at the trend line 1795. Of pressure. At present, the hourly chart moving average crosses downward, and the intraday top also focuses on the pressure level 1798 transformed into the trend line. This is also the first rebound high after the overnight decline, which can be regarded as the main intraday pressure. Secondly, pay attention to the moving average pressure near 1800, which is also the break of the overnight market's accelerated decline, so the guidance role in the day is also relatively large.

The 4-hour MACD has turned red, and the daily line is also bullish, so it is enough to do more on dips in operation. The short-term support below is near the starting point of 1798 in the afternoon, and the key support is also the watershed near the low of 1793. It does not break here. Today, the overall outlook for bullishness remains unchanged. The upper short-term suppression is near 1809, and the upper break continues to be bullish to the previous high near 1814.

Gold price suggested that gold is mainly called back in today's operation thinking, and rebound is supplemented by the high altitude. The top focus will be on the first-line resistance of 1805-1810, and the short-term focus will be on the first-line support of 1780-1775.
Stay tuned!
========
2021 EA WORLD CUP FIRST GLOBAL TRADING CHAMPIONSHIP REGISTERATION IS OFFICIALLY OPEN NOW! PARTICIPATE TO WIN A GRAND PRIZE.

Leave a Reply