
The South African Rand is affected by many factors behind it, as it is the country that is rich in natural minerals but the problem is that cannot purify the most so it works hand in hand with overseas countries. Recently we have seen the gasoline price being a little steady as many thought it will rise again but the price was maintained at an average of 1.22 USD/litter from September and was last updated at October 2021 still at an average of 1.22USD/litter.
USDZAR Monthly Chart
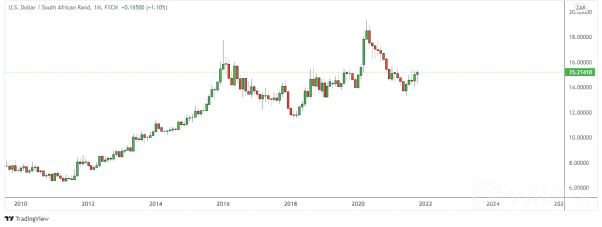
The monthly chart structure is in a clear uptrend, it has been creating new highs and new higher low points the entire time. For the past five months the rand has been losing strength, that it managed to maintain from 01 April 2020 to 03 May 2021. We can see the higher low point is slowly trying to form.
Weekly Chart
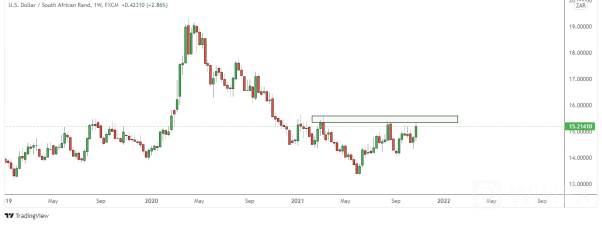
We can see the price has a resistance around 15.3000 price area, but will this resistance hold the price to even push it down further? This resistance level or supply has been tested more than three times which might lead to more traders placing their sell orders and stop losses in that area, but we also need to break that resistance/supply first to even be able to say this pair is ready to go up.
Daily Chart
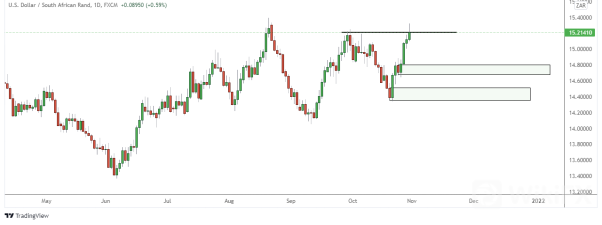
This daily chart shows a clearer price in structure, this pair is currently at the resistance level that is barely broken in this daily chart but we have a new higher low structure point that has been formed. I have drawn a few zones that the price might fall back to and we can see how the market reacts around these zones, these are ideal buy areas our points of interest but the price must break the resistance level first to even be more comfortable with taking those buys. If the price fails to break that high, we might see a downtrend starts to form if it breaks those zones and trade below 14.0000 price point
4-Hour Chart
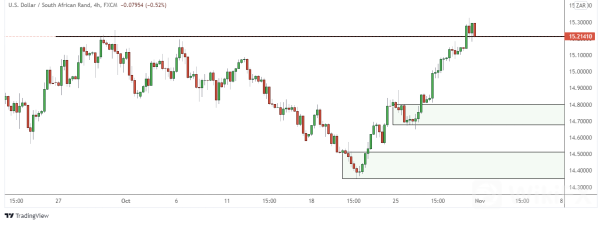
This chart shows us even deeper to what is currently happening with this pair, we can see that there has been an attempt on breaking that daily high. There is a lot of 4-hour lower highs that has been broken which signals that the momentum to the bullish trend is kicking in and it is getting stronger. These drawn zones are even clearer too, but we still need more data to even think of taking any trade at the moment.
In overall it looks like the South African Rand could be weaker if that daily black resistance/supply gets broken. From the monthly chart we have seen that compared to the dollar the Rand have not been the strongest currency but also, we can still wait and see how this currency is going to react to certain levels as it seems like it is approaching 16.0000 price mark. WikiFX has more valuable content in terms of brokers and how you can take advantage of this USDZAR trend.
Leave a Reply